

Second-Quarter Earnings and Tips on Analyzing the Numbers
by Charles Rotblut | July 05, 2018
Second-quarter earnings will begin to heat up next week. Thomson Reuters projects S&P 500 index earnings growth of 20.7% and revenue growth of 8.1% on a blended basis. (The blended number uses results from both the 20 S&P 500 companies that have reported as of this morning and the consensus forecast of analysts’ estimates for those companies that have yet to report.) Both growth projections are being boosted by big expected year-over-year increases in the large-cap energy companies’ earnings (141.2%) and revenues (19.9%). Only four of the 11 sectors comprising the S&P 500 aren’t projected to achieve double-digit growth in profits: consumer staples (9.6%), telecom services (8.1%), real estate (2.2%) and utilities (1.2%).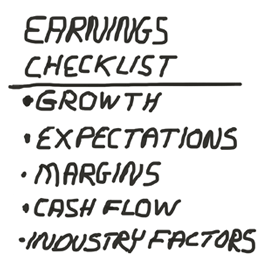
Tariffs and raw material costs will be among the things likely brought up during conference calls. The June Institute for Supply Management (ISM) manufacturing report included several comments about higher metal and component costs. Rising freight costs are another issue—and one that hasn’t been receiving as much attention. Nonetheless, economic growth is helping revenues, while lower taxes are helping net income.
Whenever a company you’re invested in, or are kicking the tires on, reports quarterly (or annual) results, it’s a good idea to look at the actual earnings report instead of relying on a news article or a headline. Doing so will give you a better assessment of how the company is actually faring. This week, I’m going to share with you some of things I look at when analyzing earnings. As I explained when I shared this list back in February 2017, it’s not a completely formulaic process since every company has different divisions and statistics, but it is something you can use as a checklist.
• Home in on Revenue, Earnings per Share and Net Income—The very first thing to do is to determine the rate at which revenues, earnings per share (EPS) and net income have changed. Have they grown or decreased compared to the same period a year ago? How do the growth rates for each line item compare to the other two? If profits grew faster than sales, the company’s margins widened. If sales grew faster, margins shrank. If EPS grew faster than net income, then EPS was boosted by a reduction in the share count. Depending on how the earnings release is formatted, it can be easier to simply calculate the growth rates yourself.
• Compare EPS to Expectations—In any given quarter, about two-thirds of companies tracked by analysts beat their consensus earnings estimates. A miss should be explained by the company. If it’s merely the timing of a key order or another temporary event, giving the company a pass on an earnings miss may be justified. If the company simply disappointed and you didn’t intend for the stock to be a contrarian play when you bought it, consider whether or not your sell rules are being violated. (Earnings estimates can be found on most financial websites, including AAII.com. Type a ticker in the Markets section of the AAII.com home page to call up a stock quote and then click on Earnings from the quote page menu.)
• Examine Margins—A company’s executive team will do their best to put a positive spin on earnings, but profit margins may tell you a different story. Look to see whether gross margins (gross profits divided by revenues) and operating margins (operating profits divided by revenues) increased or decreased. Then look through the narrative of the press release to find out why margins changed. If margins narrowed, determine if it is the result of competitive pressures, a change in the product mix or some other factor such as higher raw material costs.
• Calculate Free Cash Flow—Not all companies release their cash flow statement with their earnings, but many do. If so, calculate how much free cash a company generated. At AAII, we calculate free cash flow as cash flow from operating activities less capital expenditures and dividend payments. It should generally be positive unless the company had a big expenditure, such as a plant expansion, or the company has a seasonal business pattern. Some companies will talk about their EBITDA (earnings before interest, taxes, depreciation and amortization) figure. It’s a proxy for free cash flow, but the cash flow statement is harder to manipulate through accounting decisions than the income statement is.
• Check Industry-Specific Factors—There is no substitute for knowing the company you are analyzing because key metrics will vary especially depending on the industry it operates in. For hotel companies, such as Marriott International Inc. (MAR), RevPAR (revenue per available room) matters. For insurance companies such as UnitedHealth Group (UNH), the combined ratio (the percentage of premiums paid out as claims) matters. Airline companies, such as Alaska Air Group Inc. (ALK), report load factor, a measure of how full their planes are. (Investors want the load factor to be high; travelers want the number to be low.) The key here is to figure out what the key trends in a company’s business are and then look for the data and commentary in the press release that show how those trends are evolving.
• Look Over Other Information—I will read through the earnings press release and scan through the conference call transcript. I’m looking for color on what is happening with the business and within the industry. If there is guidance, I will compare it to the guidance given in the previous quarter. Some companies may also announce dividends or changes to their stock buyback programs in conjunction with announcing their results.
• Keep Notes—Maintaining a log of how a company is performing will help you identify trends as they evolve. These notes do not have to be formal, or even in complete sentences. They only have to be in a form you understand and can quickly refer back to. Jot down a quick summary of the data from the points above as well as reasons to explain the trends.
I’ll admit that doing this type of analysis does require some time and effort, but it takes less than you might think. I can often get through an earnings announcement in 15 to 20 minutes, including taking notes. By making the effort, I learn what is going on with the company and can better determine if the stock still matches my reasons for buying it.

- 16 Financial Ratios for Analyzing a Company’s Strengths and Weaknesses – Ratios allow you to determine whether a company is performing as well as or worse than its executives would have you believe.
- What You Can Learn From Shareholder Letters – Commentary from a company’s executives can add valuable color to the numbers if you know what to look for.
Optimism among individual investors about the short-term direction of the stock market decreased further, falling to a three-month low. This week’s AAII Sentiment Survey also showed higher neutral sentiment and lower pessimism.
Bullish sentiment, expectations that stock prices will rise over the next six months, declined 0.6 percentage points to 27.9%. Optimism was last lower on April 11, 2018 (26.1%). The historical average is 38.5%.
Neutral sentiment, expectations that stock prices will stay essentially unchanged over the next six months, rebounded by 2.1 percentage points to 32.9%. The rise keeps neutral sentiment above its historical average of 31.0% for the 20th consecutive week.
Bearish sentiment, expectations that stock prices will fall over the next six months, pulled back by 1.5 percentage points to 39.3%. The historical average is 30.5%.
Optimism is now at an unusually low level (more than one standard deviation below its historical average). Historically, unusually low bullish sentiment readings have been followed by above-average, and above-median, six- and 12-month returns in the S&P 500 index. (We published a table with the historical data last December.) However, there is no guarantee that history will repeat.
This week’s decline in pessimism puts bearish sentiment back within its typical range. The upper end of this range is 39.8%.
Many—but not all—individual investors anticipate continued volatility and/or think that the current political backdrop could have a further impact on the stock market. Trade policy is influencing some individual investors’ sentiment as well. While many approve of the Federal Reserve’s plan to continue gradually raising interest rates, some AAII members are concerned about the impact that rising rates will have. Also influencing sentiment are valuations, tax cuts, earnings growth and economic growth.
This week’s special question asked AAII members how the stock market’s performance during the first half of the year compared to what their expectations were back in January. Approximately 45% of respondents describe returns as being worse than expected. Some of these respondents describe stocks as performing “a bit worse” than they had anticipated. Three out of 10 respondents (30%) describe returns as matching expectations. Slightly more than 8% think the market performed better than expected, while 4% say the market was more volatile than they had anticipated.
Here is a sampling of the responses:
- “My expectations were, as were many others’, way too optimistic at the beginning of the year.”
- “It’s been choppier than I expected.”
- “A little disappointing.”
- “Close to what I expected, which was greater volatility and so-so performance. Tariffs are a big concern now.”
- “It has done better than expected.”

Bullish: 27.9%, down 0.6 points
Neutral: 32.9%, up 2.1 points
Bearish: 39.3%, down 1.5 points
Bullish: 38.5%
Neutral: 31.0%
Bearish: 30.5%
June 28, 2018 The New 1040 Is Shorter, But Not Simpler
June 21, 2018 A Few Observations About the Dow’s Latest Change
June 14, 2018 Kahneman on Decision-Making, and Other Morningstar Conference Notes
June 7, 2018 The Number of Investments to Hold in Your Portfolio

Discussion
No comments have been added yet. Add your thoughts to the discussion!
You need to log in as a registered AAII user before commenting.
Create an account