

Stock Buybacks Are Being Maligned
by Charles Rotblut | August 16, 2018
Stock buybacks have been the topic of discussion lately. Not from an investment strategy perspective, but more so from the perspective of what corporations should be doing with their cash. This is not surprising given the tax cuts, strong corporate earnings and the ongoing conversations surrounding worker pay. While some of the arguments may seem new, buybacks have long had their detractors.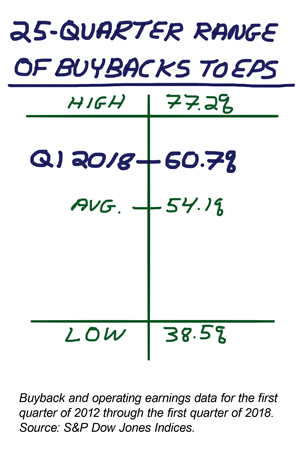
As the new tax law was being put together last year, there were some concerns about corporations using the savings to repurchase shares of their stock. During the first quarter of 2018, S&P 500 index companies spent a record $189.05 billion on share repurchases, according to data from S&P Dow Jones Indices (SPDJI). Last week, SPDJI senior index analyst Howard Silverblatt tabulated second-quarter buybacks as totaling $164.4 billion based on data from the 85% of S&P 500 companies to have reported as of August 10, 2018. This puts last quarter on pace to rank second in terms of total dollars spent on share buybacks.
It’s not just buybacks that have grown. Dividends totaled $109.18 billion in the first quarter and $111.60 billion in the second quarter this year. Yet dividends have not gotten the pushback that buybacks have.
Given the large absolute size of these numbers, some perspective is needed. As a percentage of market capitalization, first-quarter 2018 buybacks and the combination of buybacks and dividends relative to market capitalization were above the 25-quarter average (first quarter of 2012 through the first quarter of 2018), but not significantly so. Buybacks represented 0.84% of market capitalization, versus an average of 0.76% based on data from SPDJI. Buybacks and dividends accounted for 1.33% of market capitalization, versus the average of 1.28%. Changing the reference point to profits, buybacks accounted for 60.74% of first-quarter 2018 operating earnings, versus the historical average of 54.15%. Buybacks plus dividends accounted for 95.81% of earnings, versus an average of 91.69%. In neither case do buybacks appear to be historically high.
Even with this perspective, there is criticism that can be levied at buybacks. Some research suggests that corporate executives are using buybacks to put more cash into their own accounts. Requiring share repurchases be disclosed within two days of the transactions being made (as is the case with insider transactions) would make it easier to identify such behavior. Share repurchases only directly put money into the pockets of investors who sell shares back to the company doing the buybacks. Investors who sell shares on the open market—like you and I do—will never know if we’re selling to the company buying back shares or to another investor. Dividends, conversely, directly put cash in the pocket of each investor, proportionate to the number of shares they own. Dividends are also stickier and thereby create more pressure on executives to act in the best interest of shareholders.
Then there is the argument about money being diverted to repurchases. Some believe buybacks siphon off dollars that could be or should be allocated to capital investment. Others allege the money spent on buybacks could be better used to boost wages. Blaming low/stagnant wage growth on dividends is an oversimplification of a much broader problem regarding worker pay, and certainly one whose scope extends far beyond that of this weekly commentary. As far as capital expenditures are concerned, low interest rates and favorable credit conditions have made access to capital easy for many years. The Securities Industry and Financial Markets Association (SIFMA) tabulates a record $1.67 trillion of corporate bonds being issued last year and $11.16 trillion being issued between 2010 and 2017. Issuance for this year has totaled $877.8 billion though the end of July. Bluntly put, if corporations wanted to raise money to fund capital investments, they could have.
Just because access to capital is easy doesn’t make overspending on capital projects a good decision. Research shows that companies with asset bloat tend to underperform those with lower proportionate levels of assets. There is no doubt that capital investment is good for both shareholders and the U.S. economy when done right, but excess cash is better distributed back to shareholders when corporate executives cannot find productive uses for it.
There are positive aspects to buybacks. Cash spent on share repurchases is money not wasted on value-destroying mergers or other empire-building projects. Buybacks offer the flexibility of being able to return more money to shareholders when cash is available and less when there is a need to conserve capital or allocate it to other things (e.g., the construction of a new facility). When buybacks are greater in size than share issuances are, buybacks increase the ownership interest that each remaining share outstanding represents. This, in turn, boosts returns. Data from Dartmouth professor Kenneth French shows that stocks of companies with a decrease in the number of shares outstanding returned 18.0% on an annualized basis between 1964 and 2017. This return is greater than that of companies whose net share count did not change and significantly higher than those with proportionately large net share issuances.

- Stock Buybacks: Misunderstood, Misanalyzed and Misdiagnosed – New York University professor Aswath Damodaran discussed the pros and cons of share repurchases in this 2015 AAII Journal article.
- Corporations Do Not Optimize Share Repurchases – Shareholders would realize a bigger benefit if executives simply followed a dollar-cost averaging approach to stock buybacks.
Pessimism among individual investors about the short-term direction of the stock market dipped back below its historical average in the latest AAII Sentiment Survey. Neutral sentiment rebounded, while optimism was nearly unchanged.
Bullish sentiment, expectations that stock prices will rise over the next six months, declined by a slight 0.2 percentage points to 36.2%. Optimism remains below its historical average of 38.5% for the seventh time in eight weeks.
Neutral sentiment, expectations that stock prices will stay essentially unchanged over the next six months, rose 2.1 percentage points to 34.8%. The rise keeps neutral sentiment above its historical average of 31.0% for the 25th time in 26 weeks.
Bearish sentiment, expectations that stock prices will fall over the next six months, fell 2.0 percentage points to 29.1%. The historical average is 30.5%.
Pessimism was above average for two consecutive weeks prior to this week’s drop. We point this out because it has been approximately a year since bearish sentiment was above its historical average for a span of more than three consecutive weeks. Pessimism ranged between 32.1% and 39.9% during the six-week period of August 3, 2017, through September 7, 2017.
At current levels, all three indicators are well within their typical historical ranges.
Tariffs, and the possibility of a trade war, remain front and center on the minds of many individual investors. Also influencing sentiment are Washington politics (including President Donald Trump), economic growth, interest rates (including monetary policy), valuations and corporate profits.
This week’s AAII special question asked AAII members how important it is to them that the S&P 500 index set a new record high in the short term. Three out of five respondents (60%) say that it is not important. Many of these respondents describe themselves as being long-term investors and not concerned about short-term market fluctuations. About 15% say a new high is important because it would be a sign of the bull market being able to continue.
Here is a sampling of the responses:
- “Not important. I’m a long-term investor.”
- “I would like to see a new record high, but it’s not too important to me.”
- “Not important because that index doesn’t reflect the overall market very well.”
- “Not terribly important over the short term. Market fluctuations are not unusual.”
- “Very important—doing so will confirm a strong, secular bull market.”

Bullish: 36.2%, down 0.2 points
Neutral: 34.8%, up 2.1 points
Bearish: 29.1%, down 2.0 points
Bullish: 38.5%
Neutral: 31.0%
Bearish: 30.5%
August 9, 2018 Selecting Stocks From a Screen
August 2, 2018 Seeking More Than One Factor Can Boost Returns
July 26, 2018 Bitcoin and Other Notes From the CFA's Financial Analysts Seminar
July 19, 2018 Some Thoughts About Allocating to Cash

Discussion
No comments have been added yet. Add your thoughts to the discussion!
You need to log in as a registered AAII user before commenting.
Create an account