

Related

Exchange-Traded Funds

Charles Rotblut leads a class in AAII's new Essential Investing Video Course. Go to https://www.aaii.com/ves for more information and to subscribe.
Starting in April 2005, we’ve highlighted the mutual funds with the highest five-year returns. In the first article on the subject (“The Top Funds Over Five Years: What Made Them Different?,” AAII Journal, April 2005), then AAII president (and current chairman) John Markese wrote, “Five years is a sufficient period to test the fund in different market environments, but it’s also a relatively recent record and therefore still relevant.” We’ve since continued to highlight such funds, with performance tracked over bull markets and bear markets.
This year, we look back at what happened to those funds after we highlighted them. Did they continue to outperform? Did they repeat as the best five-year performers? Were they able to continue to lead their peers? How did they compare to a market benchmark?
The goal is to provide insight on a simple question: Does it make sense to focus on the mutual funds with the best five-year performance? Or is a list of the 10 best performers an interesting topic, but not something to base investment decisions on? To find the answer, we looked at the mutual funds appearing on the top-performers list to see how they performed over the following five-year periods.
We did a similar analysis with exchange-traded funds (ETFs) last September, “Do the Top ETFs Continue to Outperform?” (AAII Journal, September 2018). Among the takeaways was the impact of favorable industry and sector trends. To the extent that such trends remain strong, ETFs targeting those sectors and industries continued to do well. When the favoritism shifted to other industries and sectors, those same ETFs lagged.
Most ETFs track indexes. They are passive funds. The mutual fund industry, in contrast, is largely composed of actively managed strategies. Though index funds—particularly those managed by Vanguard—rank among the largest in terms of assets under management (AUM), the majority of mutual funds remain actively managed. This impacts mutual fund returns because their managers have leeway to adjust holdings based on the comparative attractiveness of the various securities their funds’ objectives allow them to consider.
We do know that overall sustained outperformance is not the norm. Data from S&P Dow Jones Indices’ SPIVA (S&P Indices Versus Active) Scorecard shows that the majority of the active fund managers underperform the S&P 500 index, particularly over time periods of three years, five years and longer. We also know that periods of underperformance are common even for mutual fund managers who do have good long-term returns (“The Truth About Top-Performing Mutual Fund Managers,” AAII Journal, July 2011). Still, the question remains as to whether there is longer-term momentum for investors to take advantage of.
The mutual funds analyzed appeared in the Top Mutual Funds Over Five Years articles for the years 2005 through 2014. A cutoff date of 2014 was used in order to ensure that we had five years of post-publication return data to analyze. (We stretched the definition of the post-publication return slightly by including the first two to three months before publication—January, February and, for articles prior to 2010, March of the year the top mutual funds were compiled—in the calculations.)
We limited the list to the top five funds each year for the sake of consistency. Starting in 2013, the list of the top funds was expanded to 10 in the articles. In all cases, only the top five funds were chosen here.
A fund was designated as a top mutual fund in the articles if its trailing five-year net asset value (NAV) return ranked among the 10 highest for mutual funds included in our annual Mutual Fund Guide. Returns were ranked on an absolute basis, which allowed more than one fund from the same category to appear in the top-performers list in a given year.
The funds included in those articles appeared in our annual “Individual Investor’s Guide to Mutual Funds” (www.aaii.com/guides/mfguide) either in print or in the online expanded fund data list. All funds were required to have at least five years of data. Starting in 2011, we began publishing an expanded spreadsheet with information on funds not included in the print version. Funds shown in the expanded sheet were included in the top funds’ calculations.
Inverse funds and most leveraged funds were excluded because they are not designed to be held for an extended period of time.
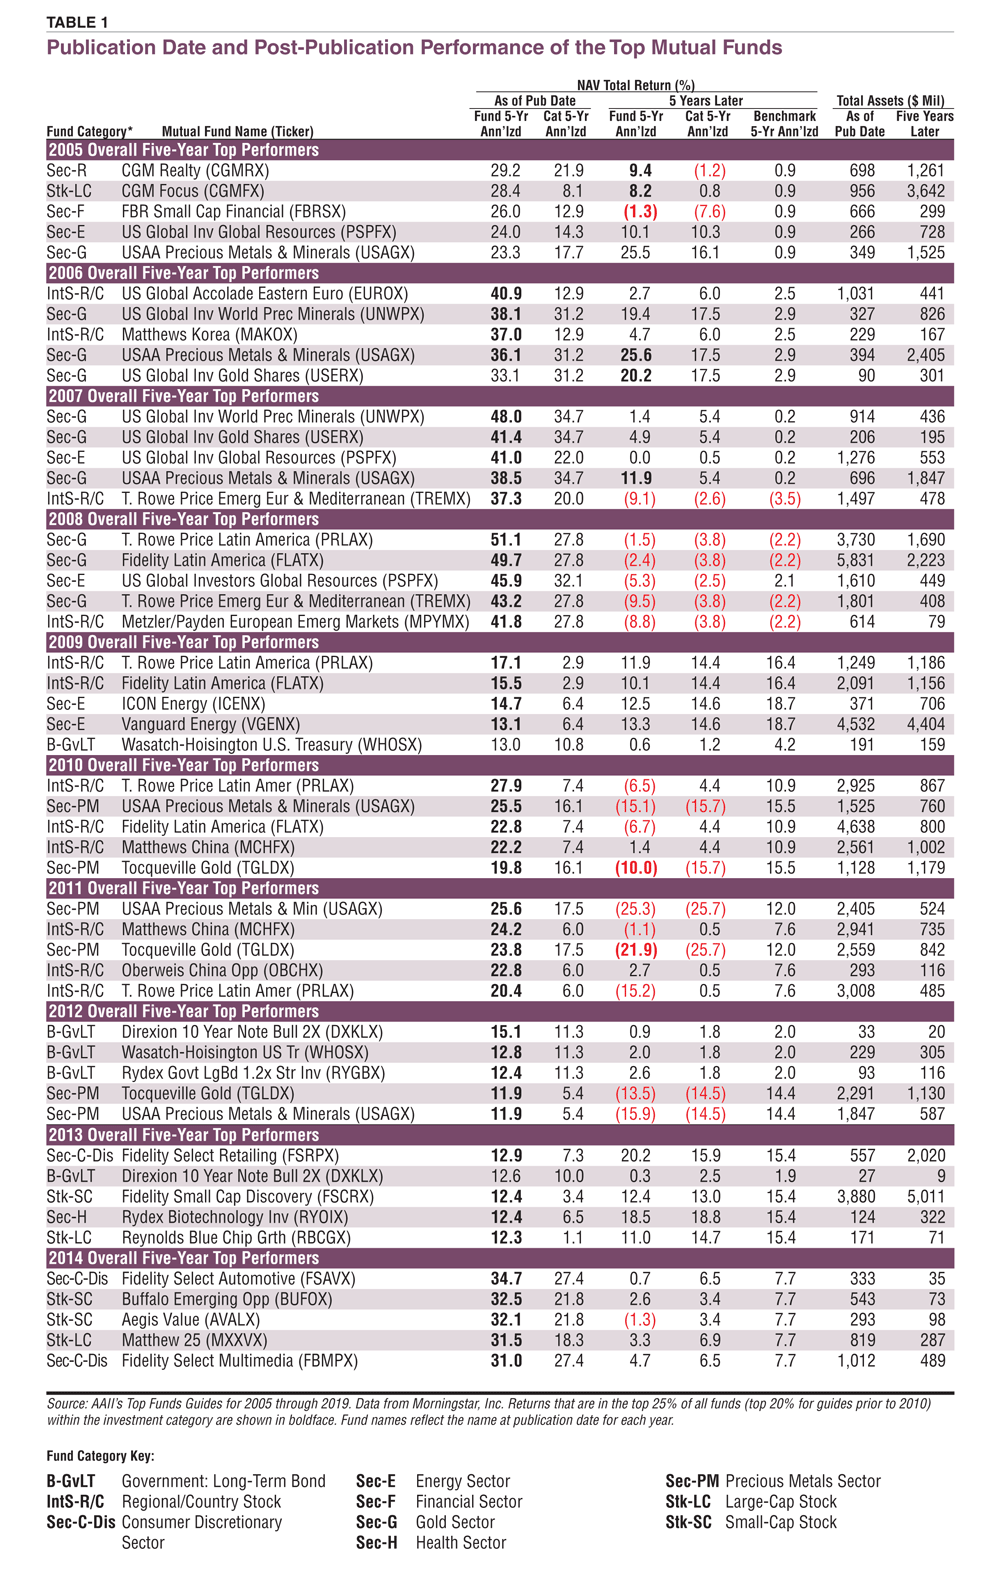
There was evidence of persistence and momentum existing over shorter time periods. USAA Precious Metals & Minerals (USAGX) appeared on the top funds six times, in 2005, 2006, 2007, 2010, 2011 and 2012. T. Rowe Price Latin America (PRLAX) made the list four times, in 2008, 2009, 2010 and 2011. Three funds made the list thrice: Fidelity Latin America (FLATX), Tocqueville Gold (TGLDX) and US Global Investors Global Resources (PSPFX). Insert Direxion 10-Year Note Bull 2X (DXKLX), Matthews China (MCHFX), T. Rowe Price Emerging Europe & Mediterranean (TREMX), US Global Investors Gold Shares (USERX), US Global Investors World Precious Minerals (UNWPX) and Wasatch-Hoisington U.S. Treasury (WHOSX) each appeared two times.
Persistence was not the rule. None of the 19 other top-performing mutual funds made the list more than once over the time period studied nor did we see them repeat in the years afterward.
Category and sector momentum played a big role in which funds repeated and how many times they reappeared. The rally in gold prices, which peaked in 2011 and stayed relatively close to its top until early 2013 helped to boost the returns of the precious metals and related funds. Strong relative returns in emerging markets—partially due to the strength in commodity prices—helped the Latin American funds. Falling interest rates gave the aforementioned bond funds a boost.
If favorable category performance led to repeated appearance on the top-performers list, then a natural question to ask is what happens after the streak ends. Does the active manager only have a hot hand when conditions are favorable, or does their skill extend once things get rougher? To find an answer, we looked at the five-year annualized returns following the last appearance on the top funds list.
The numbers speak for themselves. Out of the 11 mutual funds that appeared on the top funds more than once, just one went on to beat its category average after its last appearance as a top fund: Wasatch-Hoisington U.S. Treasury. Following its 2012 appearance, the fund went on to realize a five-year annualized gain of 2.0% versus a 1.8% gain for the long-term government bond category.
Unsurprisingly, many of the funds making the top funds list more than once outperformed their category averages during the five-year period after their first appearance. This was not universally the case, however. US Global Investors Global Resources trailed its category peers over the five-year period following its first appearance (10.1% annualized versus 10.3%), and so did T. Rowe Price Emerging Europe & Mediterranean (–9.1% versus –2.6%) and Matthews China (1.4% versus 4.4%).
Post-publication performance relative to the category averages for those funds appearing in the top funds list only once was mixed, but not favorable overall. Out of the 19 mutual funds ranking in the top five of five-year performance only once, just six went onto to best their peers over the next five years. Those six were CGM Realty (CGMRX), CGM Focus (CGMFX), Fidelity Select Retailing (FSRPX), FBR Small Cap Financial (FBRSX), Oberweis China Opportunity (OBCHX) and Rydex Government Long Bond 1.2x Strategy (RYGBX).
The mixed results are notable. If you can identify a positive category trend, there is evidence supporting the notion of taking advantage of the trend’s momentum. The mixed results of what happens to a fund after it first (and last) appeared  as a top performer indicates that there is a risk in trying to do so. Even if you identify the trend, you still must pick the right fund from among all options in the category to profit from any sustained momentum. Put another way, an investor has to get two things right before even placing any money down: identify a trend with a reasonable expectation of sustainability, and then pick the right mutual fund to invest in the trend.
We looked at assets under management (AUM) as a gauge of sentiment. Rising or fairly flat AUM suggests a willingness of investors to stick with a fund; falling AUM implies investors voted with their feet.
Sixteen funds shrunk by more than 50% during the five-year period after being designated as a top fund. The large drops occurred regardless if a mutual fund made the top fund list once or more than once. Size wasn’t a determining factor either. Fidelity Latin America (FLATX) had AUM of $5.83 billion at the end of 2008. Five years later, its AUM was just $2.23 billion, a 62% drop. Reynolds Blue Chip Growth (RBCGX) saw its AUM fall from $171 million in 2013 to $71 million at the end of 2018, a 58% drop.
Falling AUM can result in taxable events for shareholders who continue to hold on to the shares in the fund if requests for outflows force the managers to sell positions. Capital gains would be distributed even if the mutual fund incurred a loss for the year if the manager sold securities at a profit to fulfill redemption requests. It’s a case of where being among the first to the exit door can avoid unwanted taxes from mutual fund distributions. Trying to predict when to get ahead of such an occurrence is nearly impossible because it involves not only projecting the future direction of the fund, but also the actions of other shareholders and the fund manager.
Since investors always have the option of holding an index fund tracking a broad market index, we looked to see how the top funds performed relative to them. Part of the challenge in doing so is choosing the correct benchmarks. Category averages were passed on because they are impacted by many of the same factors influencing the returns of the individual funds comprising them. Index returns were passed on because they are exclusive of fees and investors cannot invest directly into an index.
This led us to settle on three index funds to use as benchmarks: Vanguard Total Stock Index (VTSMX), Vanguard Global Equity (VHGEX) and Vanguard Total Bond Index (VBMFX). The Vanguard Total Stock Index fund holds small-, mid- and large-cap U.S. stocks. The Vanguard Global Equity fund invests worldwide, including in the U.S. While it isn’t a pure foreign fund, it does represent an internationally diversified portfolio. The Vanguard Total Bond fund holds U.S. Treasury (70%) and corporate bonds (30%) of varying maturities.
Overall, funds ranking at the top in terms of five-year returns were more likely to go on to underperform their benchmarks than they were to beat them. Timing and momentum played a big role. For example, US Global Investors Global Resources exceeded its benchmark during the five-year post-publication periods of 2005–2009, but not during 2007–2012 or 2008–2013. CGM Realty beat its benchmark over the five-year period after it made the list (2005–2009), but Metzler/Payden European Emerging Markets (MPYMX) didn’t (2008–2012).
The mixed performance again shows the challenge of predicting how a fund will perform in the future based on its past performance.
Are there periods of momentum investors can take advantage of by investing in mutual funds? The data suggests there is. The challenge is identifying a trend with staying power and then picking the right fund to take advantage of it. Since both are required, the margin for error is small.
Many fund managers will enjoy periods of favorable returns. This most often occurs when there are factors beyond their control influencing their returns. When these factors turn against the funds, shareholders can vote with their feet and create potential tax problems for those investors who choose to stand pat.
The benchmark comparisons further show the difficulty of selecting a fund solely based on five-year returns. It’s not that five-year returns themselves are a poor indicator, but rather they are merely a starting point for further research. Reviewing the year-by-year returns, the fund’s objective, the factors driving the returns and the expense ratios are all important steps to take. Investors may also find themselves identifying their asset allocation needs first and then finding the right fund to fit instead of looking at performance first to narrow the down the list of mutual funds to consider.
Exchange-Traded Funds

Mutual Funds


Houyhnhnm from NM posted over 7 years ago:
JohnD from MI posted over 7 years ago:
You need to log in as a registered AAII user before commenting.
Log InCreate an account