

Related

Portfolio Strategies
Perhaps you have been parked in cash for several years—maybe even many years (e.g., since 2008). You may fear another decline—specifically in the equity markets of the world, but most notably in the U.S. equity market. These fears are understandable inasmuch as we experienced negative returns in 2018 in the S&P 500, S&P MidCap 400 and S&P SmallCap 600 indexes. These same indexes experienced large losses in 2008; those losses were 37.00% for the S&P 500, 36.23% for the S&P MidCap 400 and 31.0% for the S&P SmallCap 600.
Interestingly, the losses for calendar-year 2018 were realized during the month of December. On November 30, 2018, the S&P 500 had a year-to-date return of 5.11%. One month later the total annual return in 2018 was
–4.38%. For the S&P Midcap 400, the November 30, 2018, year-to-date return was 0.26%. By year end, the index was down 11.08%. The S&P SmallCap 600 was up 4.08% year to date as of November 30, 2018. By December 31, 2018, the small-cap index had lost 8.48% for the year. What a difference one bad month can make.
As shown in Table 1, since 2009 the large-cap segment of the U.S. stock market produced nothing but positive annual returns—until last year. For a broader perspective, since 1970 the “batting average” of large-cap U.S. stocks has been 80%—meaning positive returns in 80% of the calendar years. Over the past 10 years (2009–2018), the S&P 500 has produced positive returns 90% of the time—so we are in a positive streak that is above the 49-year average in spite of the loss in 2018.
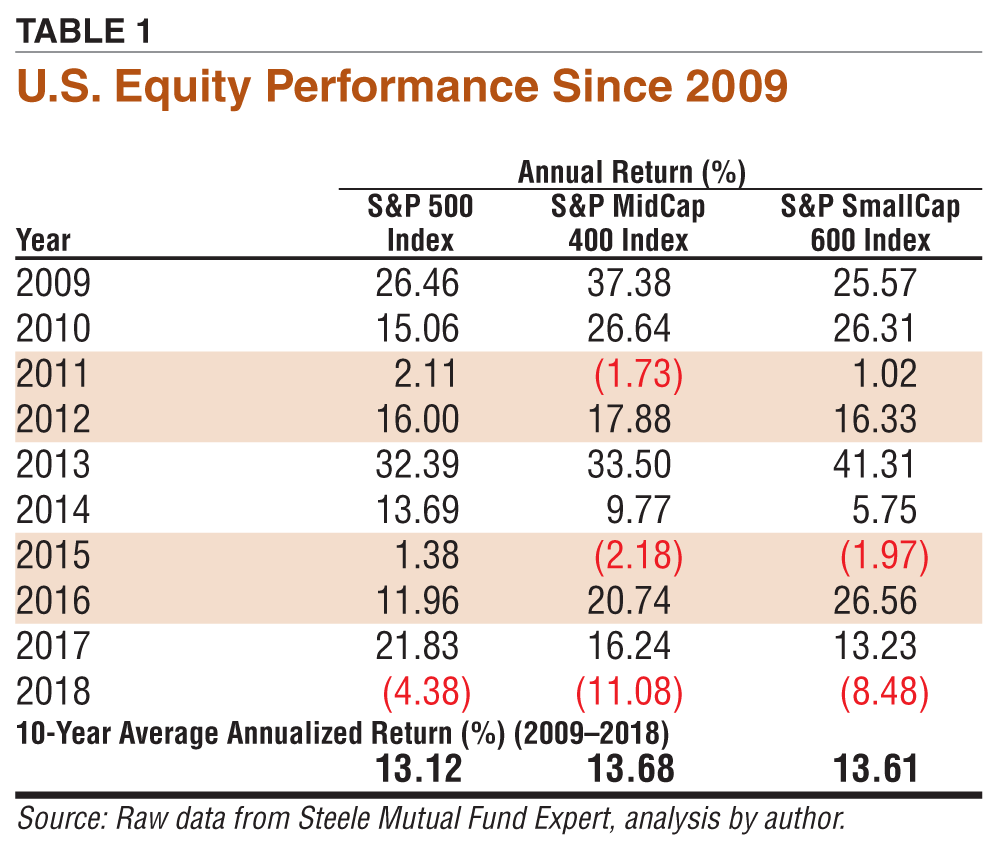
The S&P MidCap 400 does not have a performance history back to 1970, but since 1992 (the past 27 years) it has realized positive annual returns 74% of the time. Over the past 10 years, mid-cap U.S. stocks have generated positive annual returns 70% of the time—a bit under their longer-term average. However, two of those negative returns (–1.73% in 2011 and –2.18% in 2015) were trivial losses.
U.S. small-cap stocks have realized positive annual returns 69% of the time going back to 1970. Over the past 10 years, the S&P SmallCap 600 has produced positive annual returns 80% of the time—a fair bit above the long-term average.
The point is simply this: Some investors may be anticipating a decline in equity markets—particularly the U.S. equity market—beyond what was experienced in 2018. The historical averages of positive and negative returns point to such a possibility—at least for large-cap U.S. stocks. Their fears are also justified by the fact that average returns for U.S. equities (large-, mid- and small-cap) over the past 10 years (2009–2018) are each over 13%—well above the longer-term averages of 10.2% for large caps, 10.6% for small caps and just over 11% for mid-cap stocks. As a result, many of these investors are scared to start investing now because they fear the markets will tank sooner rather than later—and they want to avoid that bad timing experience.
But one cannot stay on the sidelines hunkered down in cash forever—unless that person has a ton of money and is well into their 80s. At that point, they can be as conservative as they wish. Most everyone else needs to prudently invest for the future with long-term thinking. Easier said than done when human emotions are involved.
One solution to the issue of “fear-of-bad-investment-timing” is to find an approach that is less sensitive to the timing of our investments. This approach has two dimensions: WHAT we invest in and HOW we invest. (That being said, you may still choose to keep a portion of your assets in cash. What we are talking about now is the portion of assets you choose to deploy back into noncash investment assets such as U.S. and non-U.S. stocks, bonds, real estate, commodities, etc.).
Let’s first talk about the WHAT to invest in. To dramatically simplify this discussion, I have chosen two different types of mutual funds (both happen to be Vanguard funds). One mutual fund represents the “market” as many investors refer to it—that is, a fund that mimics the S&P 500. In this case, I am using the Vanguard 500 Index fund (VFINX). Understandably, this fund is hardly a diversified approach to investing, but it does represent the type of fund that many investors think of when they contemplate getting “back into the market.” (Albeit, the term “market” should, in fact, reference a wide variety of investments—but that is a pet peeve for another day.) The Vanguard 500 Index fund has 100% exposure to large-cap U.S. stocks, and uses a market-capitalization-weighted approach. It is, therefore, an investment in just one asset class: large-cap U.S. stocks. [Note, VFINX is the ticker symbol for the Investor Shares class of this fund; it was effectively closed to most investors in 2018. The lower-cost Admiral Shares class has, for all practical purposes, replaced it and has a ticker symbol of VFIAX.]
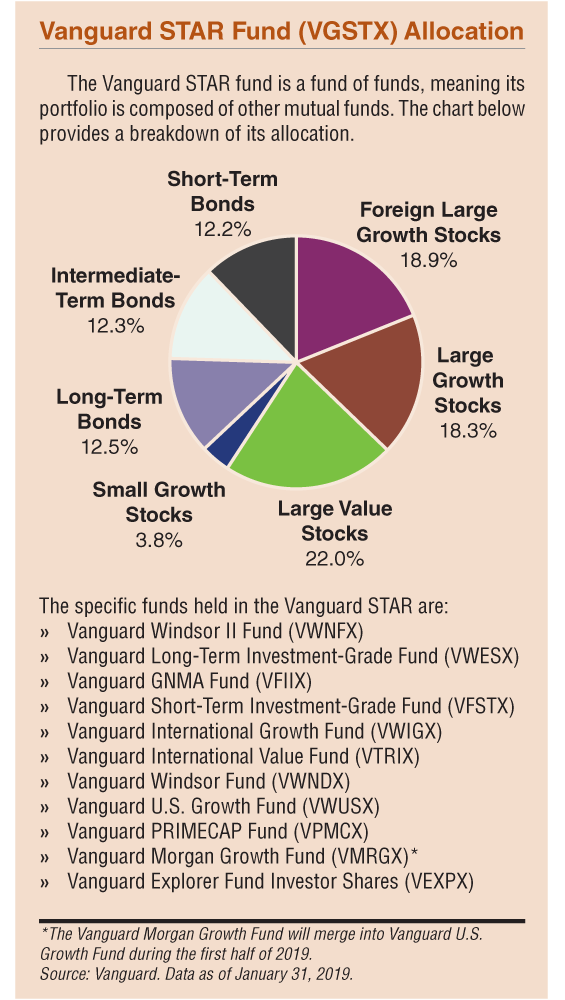
The other fund I have chosen is a fund-of-funds, specifically the Vanguard STAR fund (VGSTX). This particular fund invests in 11 other Vanguard funds and is diversified across several asset classes. Specifically, the Vanguard STAR fund has an allocation of roughly 40% to U.S. equity (with roughly 80% allocated to large-cap stocks and the balance allocated to mid caps and small caps), 20% to non-U.S. stocks, 35% to bonds and a small percentage in cash. In general terms, it employs a diversified 60% stock/40% fixed-income approach.
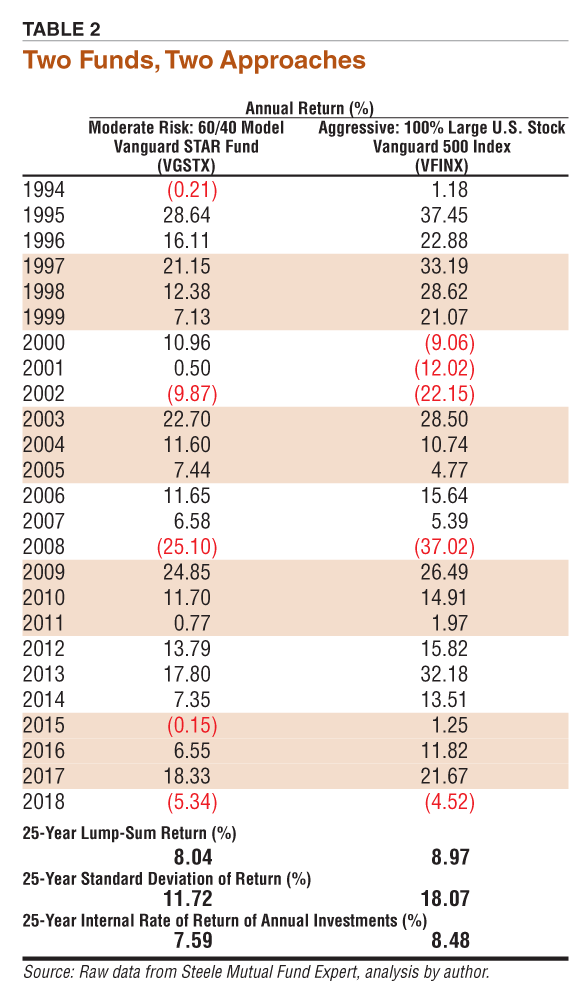
As shown in Table 2, the ending outcomes for each fund over the past 25 years is surprisingly similar. The 25-year average annualized return for the Vanguard STAR fund was 8.04% versus 8.97% for the Vanguard 500 Index fund. However, the path to those outcomes was very different—with the Vanguard 500 Index fund being far more volatile (as noted by the standard deviation figures) and incurring significant losses in 2000, 2001, 2002, 2008 as well as a small loss in 2018. This is an important issue inasmuch as it is precisely that type of volatility that may have caused an investor to pull out of equity investments in the first place. By pulling out during periods of turbulence, they would have likely failed to achieve either the 8.04% or the 8.97% return, and instead they would have likely realized a return far below both.
Here is a key observation from Table 2: The Vanguard STAR fund generated 90% of the return of the large-cap U.S. equity market (as measured by the Vanguard 500 fund) but with only 65% of the volatility because of its diversification. For skittish investors, this is an excellent trade-off between risk and reward.
The results in Table 2 assume a lump-sum investment of money at the start of 1994. In other words, the investor deposited a chunk of money on January 1, 1994, and never invested any more money over the entire 25-year period. By the way, this is the assumption behind all reported performance data.
 What if the nervous investor chose to “get off the sidelines and back into the markets” in a gradual fashion by investing money systematically over time rather than all at once upfront? This technique can reduce risk, specifically what we might refer to as “investment timing” risk, which is very likely the concern that is keeping a person on the sidelines and out of the investment markets.
Rather than reentering the market all at once (i.e., through a lump-sum investment), the investor makes regular contributions (annually, quarterly, monthly, etc.) over a period of time. In fact, this is how most of us actually invest, whether it be via a 401(k) plan, an individual retirement account (IRA) or another similar type of account.
Shown in the last row of Table 2 is the internal rate of return (IRR) when making annual investments into both funds over the past 25 years; 7.59% for the Vanguard STAR fund and 8.48% for the Vanguard 500 Index fund—both very similar to the 25-year lump-sum returns. We now have our “benchmark” returns for both of these funds based on two methods of investing: all at once or systematically over time.
Let’s now evaluate a bad timing scenario in which the investor starts to invest on January 1, 2000—just before U.S. large-cap stocks tanked for three consecutive years. This is a theoretical simulation of an investor who comes out of cash and reenters the market(s) now in 2019 only to have the U.S. equity market subsequently go into decline for several years. It is just a simulation, not a forecast.
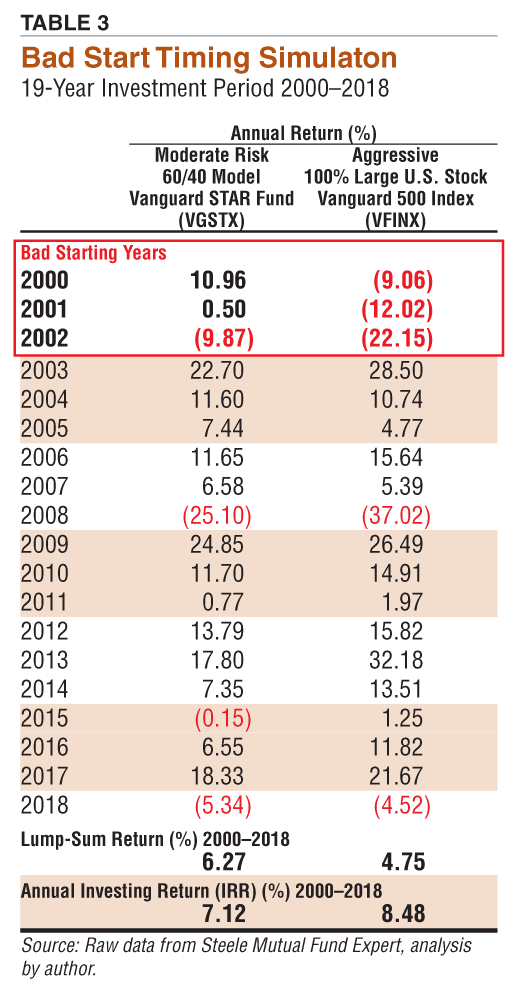
Table 3 shows the results of this sort of bad timing from a historical perspective, that is, starting to invest in stocks on January 1, 2000, and then experiencing three consecutive years of bad performance in large-cap U.S. equities (the fear of many on the sidelines right now). But wait, the declines only occurred for the Vanguard 500 Index fund, which experienced sequential losses of 9.06%, 12.02% and 22.15%, respectively. The Vanguard STAR fund had positive returns in 2000 and 2001, and a loss of just under 10% in 2002. Thus, it clearly matters WHAT we invest in. For nervous investors, the big takeaway is: diversify, diversify, diversify.
Now, to the issue of HOW we invest. In the 19-year period from 2000–2018, a lump-sum investment in the Vanguard 500 Index fund experienced the brunt of bad timing and finished with an annualized return of 4.75%. The Vanguard STAR fund fared better with an annualized return of 6.27%. Interestingly, if the investor had chosen to invest money each year (say, $3,000) into each fund, the internal rates of return for both funds were impressive: 7.12% for the Vanguard STAR fund and 8.48% for the Vanguard 500 Index fund. The idea of “bad” starting years doesn’t really apply to systematic investors who plan to stay invested for at least 15 to 20 years.
The moral of the story is that systematic investing (annually, quarterly or monthly) markedly reduces timing risk. Whereas lump-sum investors are fully exposed to timing risk, investors who “get back into the markets” by making regular contributions (annually in this analysis) may actually benefit if markets decline during the first few years. And, if markets don’t decline initially, that’s okay too. Very simply, lump-sum investors can only feel good initially if their investments have positive returns. Systematic investors can feel good either way—if performance is initially bad, they accumulate more shares with their subsequent investments. If performance is good, well … they can live with that.
So, to investors who are nervous about reentering equity investments, you may want to consider doing so gradually. It’s kind of like marathon training: Don’t start by running 26 miles.
Portfolio Strategies
Portfolio Strategies
Portfolio Strategies

Richard Kalman from CA posted over 7 years ago:
JC McCarter from Virginia posted over 7 years ago:
John Lambert from NJ posted over 7 years ago:
Brian DeWolf from IL posted over 7 years ago:
John Lambert from NJ posted over 7 years ago:
You need to log in as a registered AAII user before commenting.
Log InCreate an account