

Related

AAII Stock Ideas
Tweaking the original AAII Driehaus screening strategy by focusing more on recent earnings growth and loosening the momentum filter results in more passing companies and better performance.
by Wayne A. Thorp | May 2019

Wayne Thorp leads a class in AAII's new Essential Investing Video Course. Go to https://www.aaii.com/ves for more information and to subscribe.
Richard Driehaus probably isn’t a household name with individual investors, but he is considered by many to be the father of momentum investing.
Investopedia defines momentum investing as a “strategy to capitalize on the continuance of an existing market trend. It involves going long stocks, futures or market ETFs [exchange-traded funds] showing upward-trending prices and short the respective assets with downward-trending prices.” In addition, “Momentum investing holds that trends can persist for some time, and it’s possible to profit by staying with a trend until its conclusion, no matter how long that may be.”
Driehaus’ success as a momentum investor propelled him to Barron’s All-Century Team in 2000 alongside such well-known investors as Peter Lynch and John Templeton. It was from this that I first heard of the Chicago-based money manager, who later on became the namesake of my alma mater’s business school: DePaul University’s Driehaus College of Business.
In the April 2000 issue of the AAII Journal, I highlighted the momentum strategy of Richard Driehaus. Based on information gleaned from the book “Investment Gurus” by Peter J. Tanous (New York Institute of Finance, 1997) and the February 2000 Barron’s article “The Driehaus Rules,” I developed a screening strategy that attempted to capture the spirit of Driehaus’ momentum investing focus. Between the period from December 31, 1998, through February 28, 2019, this screening strategy generated a cumulative return of 1,174.6%. By means of comparison, the S&P 500 index posted a price gain (excluding dividend reinvestment) of 186.9% over the same period.
Following John Bajkowski’s First Cut article in the September 2017 issue of the AAII Journal, which expanded on our Driehaus screen, I dug out my old notes from when I wrote the 2000 Driehaus article. I also reread the Driehaus section of the Tanous book and did some additional research on Driehaus’ strategy. I came away with a fresh perspective on Driehaus’ approach, as well as a revised screening strategy.
It’s worth pointing out that this isn’t an attempt to optimize the Driehaus strategy. Having been in the industry for over 20 years, I have gained perspectives that I didn’t have nearly 20 years ago when I created the original AAII Driehaus strategy.
Driehaus’ brand of momentum investing involves identifying and buying stocks in a strong upward price move and staying with them as long as the upward price movement continues. Specifically, he emphasizes a disciplined approach that focuses on small- and mid-cap companies with strong, sustained and accelerating earnings growth that are also generating “significant” earnings surprises.
 Driehaus believes in the ability to retreat and sell—cutting losses short—in order to survive to fight another day. He doesn’t obsess over his win-loss ratio (the number of winning trades relative to the number of losing trades). His focus is on how much he makes on his winners and how quickly he gets out of his losers. He has no problem selling a “good-looking” stock if its price is falling. He also looks to diversify during bad times and concentrate his holdings during good times.
In contrast to successful value investors such as Benjamin Graham who seek out a margin of safety by trying to buy stocks that are trading well below their real value, Driehaus once said he took exception to the idea of buying low and selling high. He isn’t interested in picking up cheap stocks and waiting for them to recover. Instead, he stated that “I believe far more money is made by buying high and selling at even higher prices.” Driehaus doesn’t believe in a “right” price-earnings (P/E) ratio, since it can be high or low depending on where the company is in its earnings stream. In fact, Driehaus feels that the real risk of investing is being too conservative.
Driehaus sees earnings as the “fountainhead” of future stock price movements, specifically earnings growth. However, he looks at a variety of measures to evaluate earnings growth, including:
Driehaus looks for strong sequential earnings growth—both on a quarter-over-quarter (the same quarter in sequential fiscal years) basis and on a quarter-to-quarter basis (i.e., the first quarter to the second quarter of the same fiscal year).
Specifically, though, Driehaus sees positive earnings surprises as a primary catalyst for price increases. An earnings surprise takes place when a company announces earnings that differ from what analysts were expecting for that period. A positive earnings surprise occurs when a company reports earnings that exceed the consensus estimate, while a negative earnings surprise is when reported earnings fall short of the consensus estimate from analysts.
However, just because a company reports a strong positive earnings surprise doesn’t mean the stock market will react positively and push the stock price higher. This is because often when companies report their quarterly results, they also offer guidance for future quarters and years. It is not uncommon to see a company report a large positive earnings surprise, only to see its stock price suffer due to disappointing earnings guidance for future periods. For that reason, Driehaus also pays attention to management guidance. This is often reflected in changes in the consensus estimates for future periods as analysts digest the revised guidance from the company and update their earnings models. The question Driehaus seeks to answer is how earnings growth—and positive changes in earnings—will impact the company’s stock, especially relative to market expectations.
Lastly, Driehaus does not consider a company’s earnings in isolation. He also considers how a company’s earnings growth relates to the stock as well as the company’s sector and industry. In fact, Driehaus would rather buy the stock of a company that has less-powerful numbers relative to another if it is in a better industry.
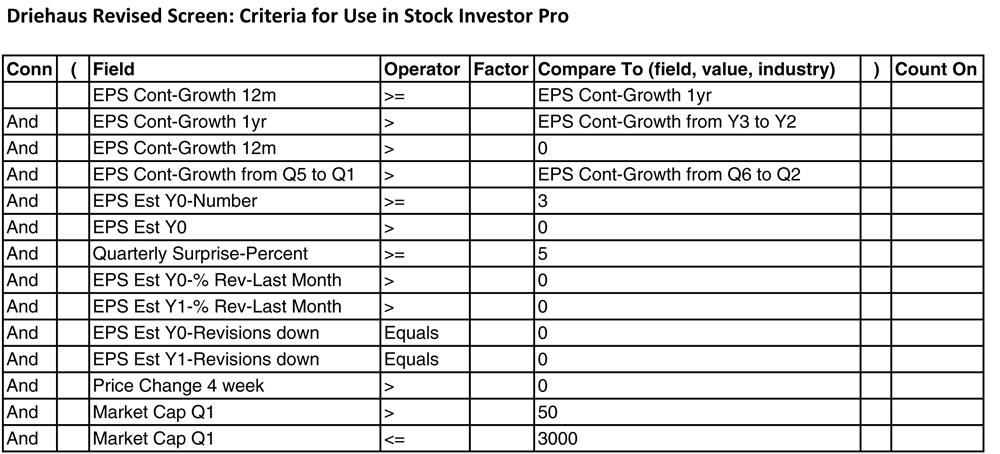
Table 1 presents the companies that passed a revised Driehaus screen created using AAII’s Stock Investor Pro fundamental stock screening and research database program with data as of February 28, 2019 (Go to the Driehaus screen webpage for a current list of passing companies). Table 2 offers a breakdown of the differences between the revised screen and the original Driehaus screen that is tracked at the Stock Ideas area of AAII.com and pre-built into Stock Investor Pro. The revised screening criteria for Stock Investor Pro subscribers to use is given in the box at the end of this article.

 The revised AAII Driehaus methodology still has earnings growth as its cornerstone, although it focuses more on recent earnings growth. To find stocks exhibiting sustained or increasing earnings per share growth, the screen first identifies those companies whose year-over-year annual earnings are increasing. The first filters use the growth rates in earnings from continuing operations from year 3 to year 2, from year 2 to year 1 and from year 1 to the trailing 12 months (last four fiscal quarters) and require earnings to be accelerating over each of those periods (the growth rate increases from period to period). The growth in earnings over the trailing 12 months compares the cumulative earnings over the last four quarters (quarters one through four) to the cumulative earnings over the four quarters prior to that (quarters five through eight).
There is a balancing act when comparing year-over-year earnings growth. You want to use enough periods to try to capture a trend but don’t want to use too many where the rest of the market has realized the trend and bid up the stock price. That is why we used one less period for the revised Driehaus screen compared to the original strategy.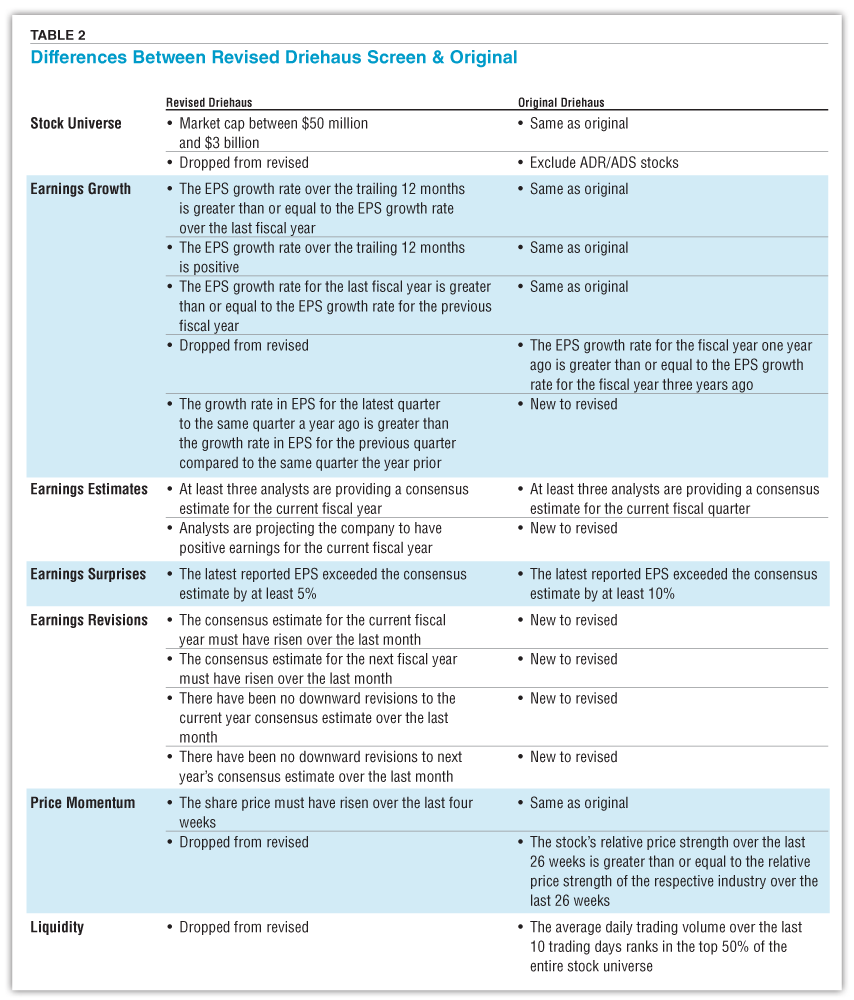
Another filter stipulates that, at a minimum, a company has experienced positive earnings over the trailing 12 months. Again, we are comparing earnings for quarters 1 through 4 to earnings for quarters 5 through 8. Many of the companies that pass the earnings growth filters are not yet profitable—they have not necessarily reported positive GAAP earnings per share for the trailing 12 months or for the last fiscal year. However, new to this revised Driehaus screen, we now require that analysts are expecting positive pro forma earnings for the current fiscal year. This helps avoid turnaround situations that can complicate the company evaluation process.
Driehaus looks at a number of periods when considering earnings growth. For that reason, our revised Driehaus screen looks at same-quarter earnings growth (as compared to sequential). Comparing data for the same quarter in different fiscal years removes any seasonality from the earnings. If you were looking at the sequential earnings (i.e., quarter 2 to quarter 1), seasonal fluctuations could significantly inflate the sequential growth one period and then create a high comparable number that would lead to a large decline the following quarter. The classic example is retailers, which usually see a spike in sales and earnings during the Christmas holiday quarter.
Therefore, the revised Driehaus screen seeks out those firms whose same-quarter earnings growth is accelerating. This screen compares the growth in earnings from continuing operations from quarter 6 to quarter 2 to the growth in earnings from quarter 5 to quarter 1. So, in effect, the screen is looking for accelerating sequential quarterly earnings growth in same-quarter earnings.
When examining earnings growth rates, it is important to keep in mind the base earnings value used to calculate the growth rate. Let’s consider, for example, two companies with 100% earnings growth from year 2 to year 1. From a pure percentage basis, both companies appear to be on equal footing. However, when we look at Company A, we see that earnings have increased from $0.01 per share to $0.02 per share over the last year, while Company B saw its earnings rise from $0.50 per share to $1.00. Looking at the raw data tells a very different story. For this reason, whenever you see very high growth rates, you should take a look at the underlying numbers to gauge the significance of the changes.
After identifying companies with accelerating annual and quarterly earnings growth, the next step in the revised Driehaus momentum strategy is to look for companies most likely to continue that trend in earnings growth. One event Driehaus suggests seeking is a “significant” positive earnings surprise, where the company’s actual reported earnings exceed the consensus estimate.
Earnings estimates are based on expectations of the future performance of a company; surprises signal that the market may have underestimated the company’s future prospects in its forecast.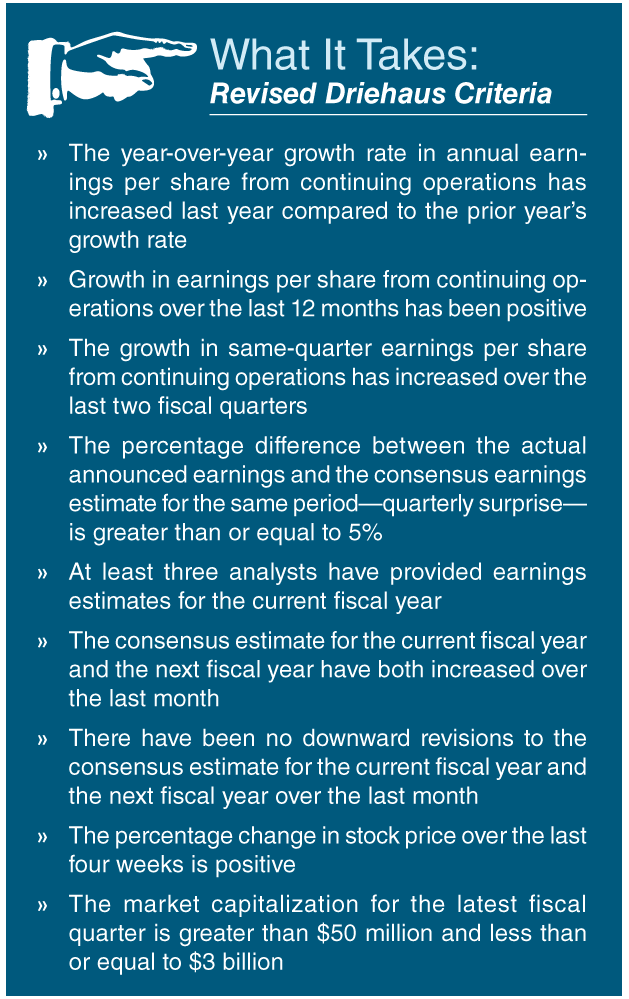
Driehaus does not quantify what he considers to be a “significant” earnings surprise. However, studies show that analysts tend to be pessimistic when it comes to their quarterly earnings estimates. Therefore, it is more likely that a company will report a positive earnings surprise than fall short of consensus estimates.
Using FactSet data as of March 29, 2019, for the calendar fourth quarter of 2018, the average earnings surprise for the companies in the S&P 500 was 3.5%. AAII’s Stock Investor Pro data as of March 29, 2019, showed an average earnings surprise of 0.08% for the 3,683 companies with earnings surprise data. The median or midpoint surprise was 3.0%. Therefore, any earnings surprise screen would want to seek out companies with an earnings surprise sufficiently above the norm and consider the apparent downward bias in analysts’ estimates.
For the revised Driehaus strategy, we required that the latest reported earnings for a company must have exceeded the consensus estimate by at least 5%. This is a change from the 10% surprise required for the original Driehaus screens. We chose to be less restrictive to allow for more passing companies, yet we feel that the 5% level is still a significant surprise, given historical trends in earnings surprises.
Beyond looking for companies reporting strong positive earnings surprises, Driehaus also suggests looking for upward revisions in future-period consensus earnings. These upward revisions are a proxy for stronger-than-anticipated company results or upward earnings guidance from management.
When examining earnings revisions, there are both quarterly and annual estimates to consider. For the revised Driehaus screen, we chose to look at revisions in the current and next fiscal year’s consensus estimates. Specifically, the consensus estimates for both the current fiscal year and the next fiscal year must have increased over the last month. We feel that full-year estimates are more meaningful, since they cover longer periods than just a single quarter.
In addition, there cannot have been any downward revisions to the consensus estimates for the current fiscal year or next fiscal year over the last month.
It is worth mentioning that the estimate revisions filters in the revised Driehaus screen do create cyclicality to the number of passing companies. Depending on the period within the earnings calendar cycle, very few companies may be reporting earnings or updating guidance. As a result, few companies will see their consensus estimate change. It is not uncommon, therefore, for the revised Driehaus screen to see a sharp drop-off in the number of passing companies at the tail end of an earnings season or at the very beginning of a new season.
As a momentum investor, Driehaus remains invested in a stock until he sees a change in the underlying company, industry/sector or overall market. He is quick to point out, however, that he is not a market timer. Instead, he goes where the data tells him to go (or not go). He has no qualms with buying a stock that has already seen a significant and rapid rise in price if he believes that momentum will continue.
The only price momentum filter we use for the revised Driehaus screen is the requirement that price must have risen over the last four weeks. We removed the requirement from the original Driehaus screen that a company’s 26-week price strength relative to the S&P 500 exceed that of its industry’s price strength relative to the S&P 500 over the same period, as measured by the price changes of the stocks in a respective industry. While Driehaus likes to find companies in strong sectors or industries, this requirement does not capture groups that were outperforming the overall market.
Richard Driehaus focuses most of his energies on small- and mid-cap stocks, as they provide the growth he is looking for. Historically, and over longer periods, small-cap stocks have done better than larger stocks, with the trade-off of having higher volatility. However, most volatility measures consider both upside and downside volatility, and Driehaus doesn’t fear upside volatility.
There are differing definitions of market-capitalization categories, but for the purposes of the Driehaus screens, we define small- and mid-cap stocks as those ranging from $50 million to $3 billion in market capitalization.
Among other filters that were part of the original Driehaus screen that we did not incorporate into the revised strategy are:
Over the years, Driehaus’ money management firm has broadened its scope to international markets. For that reason, we are not excluding American depositary receipt firms (ADRs), which are foreign companies trading on U.S. exchanges.
The original Driehaus screen also set a minimum average trading volume to exclude companies that may be lacking liquidity. However, smaller companies, by their nature, tend to have lower trading volumes. Instituting trading volume restrictions on a screen that is purposefully isolating smaller companies, in some ways, is counterproductive.
Figure 1 shows that the AAII Driehaus Revised screen generated an average annual return of 18.5% from the beginning of 1999 through the end of February 2019. By comparison, the original AAII Driehaus screen generated an average annual return of 13.5% over the same period. The revised screen significantly outperformed the various S&P size indexes as well as the typical exchange-listed stock during the same time.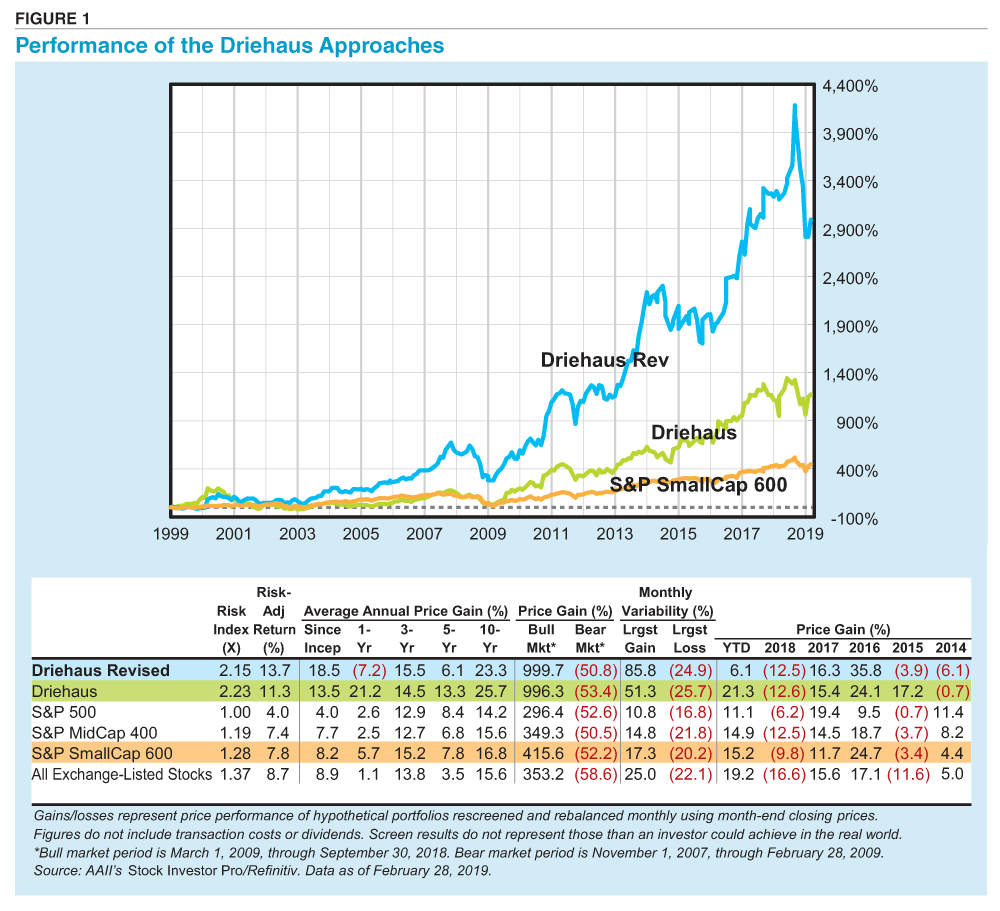
However, underlying this performance is higher volatility. The revised Driehaus screen has a risk index of 2.15, compared to 1.0 for the S&P 500 index. This means that this methodology has been 2.15 times more volatile than the large-cap index over the last 36 months. It does have a slightly lower risk index than the original Driehaus screen (2.23). During the last bear market, the revised Driehaus approach lost 50.8%, which was on par with the S&P indexes and the typical exchange-listed stock. It did perform slightly better than the original Driehaus screen, which lost 53.4% during the last bear market. Since the end of the last bear market and through the end of September of last year, the revised Driehaus screen has rocketed upward by 999.7%, compared to a 374.4% total return for the S&P 500 and a 353.2% gain for the typical exchange-listed stock.
Table 3 highlights the characteristics of the stocks meeting the AAII Driehaus Revised screening criteria as of the end of February.
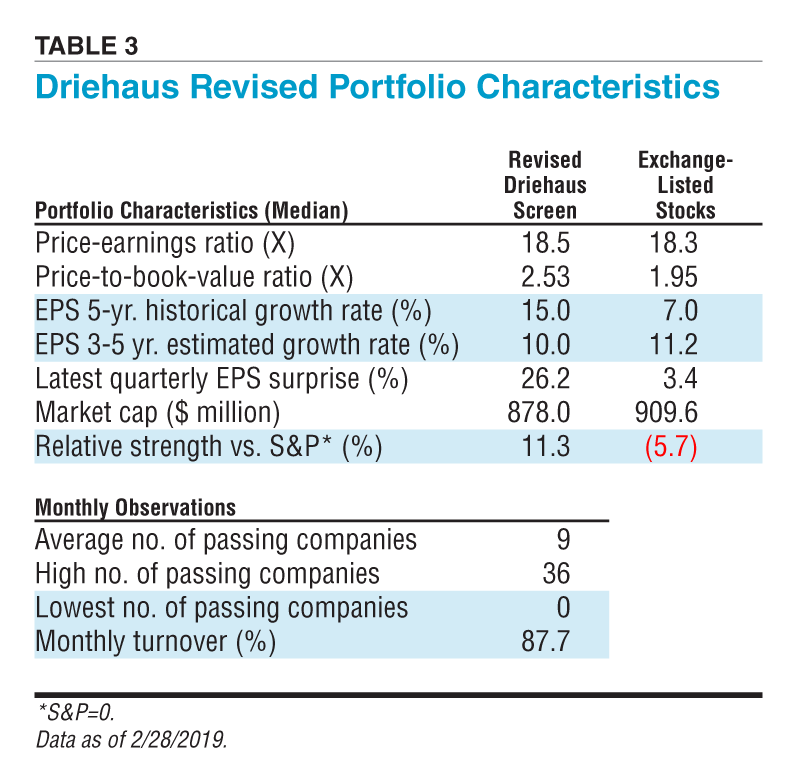
Growth and momentum investors are willing to accept higher price multiples such as price-earnings ratio and price-to-book-value ratio, as they are more concerned with growth (earnings, dividends, cash flow, etc.) and upward price movements than buying cheap assets. The companies passing the AAII Driehaus Revised screen as of February 28, 2019, have a median price-earnings ratio of 18.5, which is mainly in line with the 18.3 median price-earnings ratio for the typical exchange-listed stock. These passing companies carry a high median price-to-book-value ratio relative to the typical exchange-listed stock (2.53 versus 1.95).
In order to pass the AAII Driehaus Revised screen, a company must have annual earnings per share growth that is better than that of the previous year, as well as same-quarter earnings growth for the latest fiscal quarter that is greater than the same-quarter earnings growth for the previous quarter. (Note that this does not necessarily mean that the earnings growth rate itself is positive, but only that the rate of change is.) This requirement has translated into a median average earnings growth rate of 15.0% over the last five years, compared to 7.0% average annual earnings growth over the same period for the typical exchange-listed stock.
Looking forward, the median estimated annualized growth in earnings per share for the current Driehaus Revised companies is 10.0%, which is surprisingly lower than the 11.2% projected growth rate for exchange-listed stocks.
Rapidly growing firms such as those sought by Driehaus tend to be small in nature, as measured by market capitalization. Analyzing the companies currently passing the AAII Driehaus Revised screen, we find that they have a median market cap of roughly $878 million, which places them at the upper end of the small-cap spectrum. In comparison, the median market capitalization for exchange-listed stocks is slightly under $910 million.
The current Driehaus Revised stocks have outperformed the S&P 500 by 11% over the last 52 weeks. In contrast, the typical exchange-listed stock has underperformed the S&P 500 by nearly 6% over the same period.
There are currently 14 companies satisfying the criteria of the AAII Driehaus Revised screen. This is above the monthly average of nine passing companies the approach has seen since the start of 1999. Over this period, the screen has had no passing companies in four months and as many as 36 stocks in one month.
Finally, given the strict earnings growth and price momentum requirements of the Driehaus methodology, it is probably not surprising that it has one of the highest monthly turnover rates among the screening strategies that AAII tracks. In a given month, over 88% of the stocks that pass the revised Driehaus screen did not pass the month before. This monthly turnover rate is also the highest among the growth with price momentum strategies followed at AAII.com.
The momentum approach to stock selection developed by Richard Driehaus seeks to hit the “home run” that will provide above-normal returns. When investing in such potentially volatile stocks, it is very important to have a system in place that gets you out of a trade with only a minimal loss, while allowing the winners to ride until their momentum burns out. As the tech bubble of the late 1990s and the financial crisis of 2008–2009 showed, momentum strategies can crash back to earth very quickly, with potentially devastating consequences for investors.
As always, keep in mind that screening is only the first step in the investment process. The stocks passing this, or any other screen, do not represent a “recommended” or “buy” list. Before making any investment decisions, it is important to perform adequate due diligence to identify those stocks that match your investing tolerances and constraints.
Download this excel worksheet.
AAII Stock Ideas

Investor Professor


John Roediger from ME posted over 7 years ago:
Wayne A. Thorp, CFA from IL posted over 7 years ago:
ron omegna from NJ posted over 7 years ago:
ron omegna from NJ posted over 7 years ago:
Duncan H from WA posted over 7 years ago:
Doug K from GA posted over 7 years ago:
Jim F from MI posted over 7 years ago:
Sam M from FL posted over 7 years ago:
Ashok J from FL posted over 7 years ago:
Jim L from MI posted over 7 years ago:
Wayne A. Thorp, CFA from IL posted over 7 years ago:
from IL posted over 7 years ago:
Bob from PA posted over 7 years ago:
You need to log in as a registered AAII user before commenting.
Log InCreate an account