



Related

Stock Strategies
An updated look at the characteristics of AAII’s screening approach based on a legendary wise buyer of out-of-favor stocks.

Derek Hageman leads a class in AAII's new Essential Investing Video Course. Go to https://www.aaii.com/ves for more information and to subscribe.
Sir John Templeton became a successful investment adviser after studying under the father of value investing, Benjamin Graham. Templeton quickly identified with the philosophy of contrarian investing and continued to train in the art of value investing. In his work, Templeton applied Graham’s ideas to new situations, showing how well value investing could work in international stocks, including emerging markets.
 Value investing concentrates on unappreciated stocks trading at attractive prices—bargain stocks. Templeton was always out bargain hunting and looking for the best-priced stocks. His philosophy was to buy out-of-favor companies that were beginning to show signs of reawakening.
Value investors look for solid companies whose stocks are trading at low multiples of price relative to book value, cash flow, earnings, dividends or sales. This contrarian way of thinking looks for such stocks with the hopes that these low multiples are temporary, that the company will withstand Wall Street’s wrath and prices will eventually rise as Wall Street realizes the true worth of the firm.
As a fund manager, Templeton pioneered the use of globally diversified mutual funds. His Templeton Growth Fund was among the first to invest in Japan in the middle of the 1960s, China in the late 1980s and South Korea after the Asian financial crisis.
Two books served as the basis for the creation of the AAII Templeton stock screening approach. Both books feature sections devoted to Templeton’s life and investing beliefs: “Lessons From the Legends of Wall Street,” by Nikki Ross, (Dearborn Financial Publishing, 2000); and “Money Masters of Our Time,” by John Train (HarperCollins Publishers, 2003). The Templeton approach found at the Stock Ideas area of AAII.com is our interpretation of Templeton’s methodology as outlined in these books.
The AAII Templeton screen focuses solely on domestic-listed firms that have:
The AAII Templeton screen is built into AAII’s Stock Investor Pro fundamental stock screening and research database. The companies meeting the criteria of this strategy each month are used to calculate hypothetical performance.
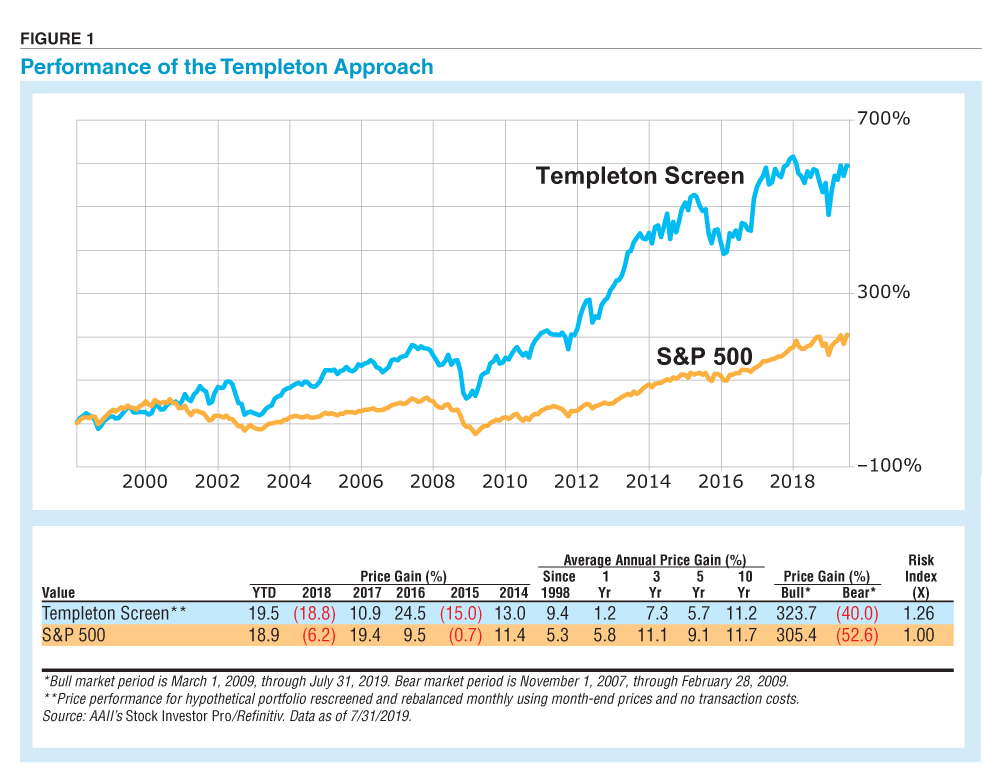
Figure 1 shows that the Templeton approach has outperformed the S&P 500 index since the beginning of 1998. It has generated a compound annual price gain of 9.4% over the period from January 1998 through July 2019, while the S&P 500 is up only 5.3% annually over the same period.
The strategy held up relatively well during the last bear market (November 2007 through February 2009), down 40.0% versus a loss of 52.6% for the S&P 500. Templeton basically viewed bear markets as the bear swinging its arm back to slap him a high five because he knew that stocks were about to get a lot cheaper and present more bargains for purchasers. The strategy has also outperformed during the subsequent bull market (March 2009 through July 2019) gaining 323.7% compared to a cumulative price gain of 305.4% for the S&P 500.
 The Templeton way has performed admirably year to date through July 31, 2019, up 19.5% versus a gain of 18.9% for the S&P 500. The Templeton approach tends to view volatility as an investor’s best ally in the search for bargains to purchase. According to “Investing the Templeton Way,” by Lauren C. Templeton and Scott Phillips (McGraw-Hill, 2008), Templeton believed that volatility presents opportunities and the greater the volatility, the greater the opportunities to locate a bargain. Volatility has increased over the past few quarters and, if the market continues to fluctuate, following the Templeton way may be a good method to find some bargains.
You can follow the AAII Templeton strategy’s performance, and see how it compares to the 59 other stock approaches that AAII tracks, at the Stock Ideas area of AAII.com.
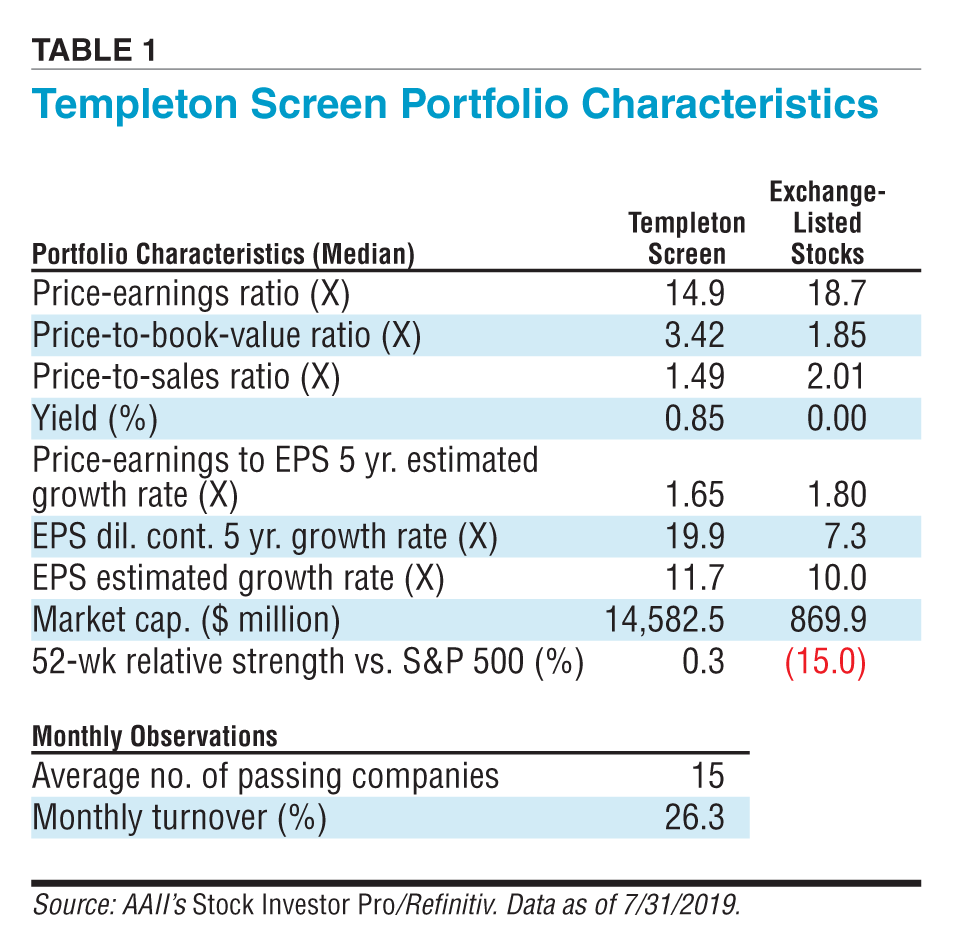
The Templeton approach searches for stocks that are attractively priced relative to some measure of intrinsic worth. The Templeton screen incorporates a low price-earnings ratio requirement as its primary price multiple—seeking stocks with a current price-earnings ratio below its five-year average and requiring the average price-earnings ratio to be below 75 for each of the last five years. As illustrated in the characteristics of the stocks currently matching the Templeton approach (presented in Table 1), the median value of the price-earnings ratio of 14.9 is below the 18.7 median value of all exchange-listed stocks.
One difficulty in implementing a low price-earnings ratio approach is separating the “good” companies—those that are simply misunderstood by the market—from the ones that the market has accurately identified as “losers.” Many low price-earnings ratio stocks are in the bargain basement because their industry, products or earnings and growth prospects do not excite investors.
Separating the good firms requires some additional, supportive filtering factors. For Templeton, such confirmation comes from what he calls future probable earnings, or forecasted earnings growth. From Templeton’s viewpoint, for any stock selection to be considered worthy, future probable earnings need to be growing.
Looking at Table 1, the stocks currently meeting the Templeton screen have a median five-year earnings growth rate of 19.9%, compared to 7.3%, for all exchange-listed stocks. The median estimated earnings growth rate of these out-of-favor passing companies is 11.7%, while for all exchange-listed stocks it is 10.0%.
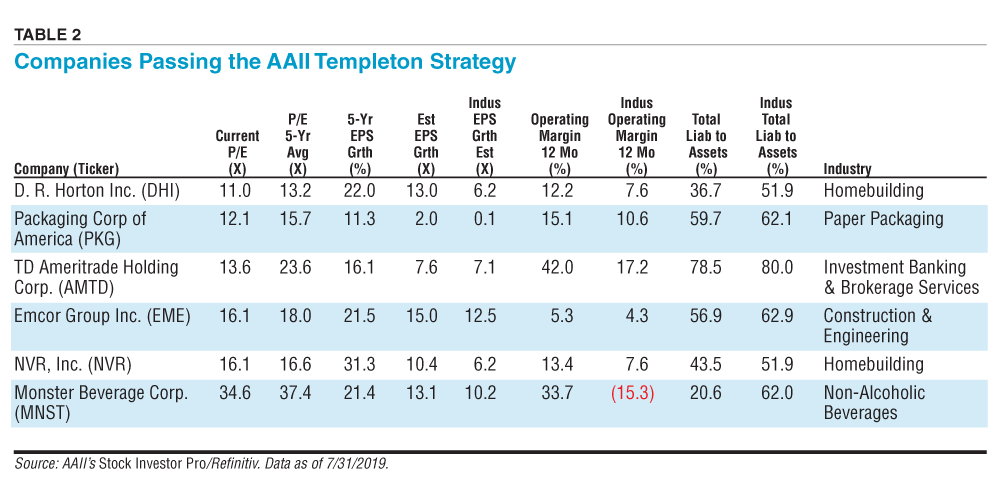
Six companies met the Templeton criteria as of July 31, 2019. They are listed in Table 2 ranked by price-earnings ratio in ascending order. The current number of passing companies is less than half of the historical monthly average of 15. [Subscribers to AAII’s Stock Investor have access to the daily results of the Templeton screen and 59 other strategies that AAII tracks.]
To meet the criteria and qualify as potentially undervalued, a company’s price-earnings ratio needs to be less than its five-year average price-earnings ratio. Interestingly, Packaging Corp of America (PKG), the third-largest producer of paper packaging in the U.S., looks undervalued on this metric as its price-earnings ratio of 12.1 is 23% lower than its five-year average of 15.7.
As mentioned above, separating the potentially undervalued “good” firms from the “bad” ones requires some additional, supportive filtering factors. Earnings per share growth is one of the primary characteristics used to measure company performance. Beyond an overall growth figure, individual investors should look at the year-to-year trends, since long-term growth rates can easily mask the variability and risk of the underlying figures.
For Templeton, a company needs both its five-year earnings growth rate and its estimated future earnings growth to be positive. In addition, a firm’s estimated earnings growth needs to be greater than the industry’s median estimated long-term growth rate.
Finally, Templeton also seeks companies with competitive advantages. This can be detected by comparing a firm’s forecasted earnings growth figures to that of its industry: Firms with estimated earnings growth rates greater than the industry’s median are more likely to have a competitive advantage. Also, a company’s year-to-year earnings must have increased over each of the last five fiscal years (Y5 to Y4, Y4 to Y3, etc.). The year-over-year positive earnings criteria is the most restrictive element of the Templeton screen.
In Table 2, NVR Inc. (NVR), a homebuilder in the Eastern U.S. with mortgage banking operations, exemplifies the earnings growth characteristics that the Templeton approach seeks. The company’s five-year historical earnings per share growth rate was 31.3%, and its estimated earnings growth of 10.4% is significantly higher than the industry median of 6.2%.
Another important characteristic for the Templeton strategy is the requirement that current operating margin be positive and greater than the five-year historical average operating margin.
Although Templeton’s global investing success is attributable to his international investments contributing significantly to his fund’s outperformance, AAII’s screen rarely includes ADR stocks. Screening for the most recent 12-month time frame reduces the probability of ADR stocks passing the filter, as ADRs are not required by the U.S. Securities and Exchange Commission (SEC) to post or file quarterly or monthly results. This criterion limits the prospects to the domestic stock group.
Templeton’s idea behind bargain hunting is to become not an unblinking contrarian but rather a wise buyer of out-of-favor stocks. By finding stocks with price-earnings ratios lower than historical averages and companies with strong and improving earnings growth rates, you may follow the Templeton way and “buy when there’s blood in the streets.”
 It may also be helpful to remember his advice: “Bull markets are born on pessimism, grow on skepticism, mature on optimism, and die on euphoria. The time of maximum pessimism is the best time to buy, and the time of maximum optimism is the best time to sell.”
Keep in mind that no matter how well a stock screening methodology has performed (or how badly it has underperformed) over the long term, stock screening is only the first step in the stock selection process.
You will want to do your homework to see why these companies are at their current levels. Only then will you gain insight into those that will continue to languish and those that may eventually flourish.
The stocks meeting the criteria of the AAII Templeton approach do not represent a “recommended” or “buy” list. It is important to perform due diligence to verify the financial strength of the passing companies and to identify those stocks that match your investing tolerances and constraints before committing your investment dollars. Keep in mind that the quantitative screens we have developed are based upon our interpretations of published works tied to the market gurus.
Stock Strategies

Financial Statements

Financial Statements

RICK P from OR posted over 1 year ago:
JOSEPH B from FL posted over 1 year ago:
You need to log in as a registered AAII user before commenting.
Log InCreate an account