


Featured Tickers:
David Dreman, chairman of Dreman Value Management, has long studied the psychological underpinnings of the overall stock market and its impact upon valuation levels. Dreman sees stocks and markets driven by emotions that often push prices from their intrinsic value. Dreman feels that the best approach to beating the market is to follow the principles of contrarian investing.
Contrarian investing involves betting against the crowd by seeking stocks that are out of favor with the market, and avoiding the fashionable, high-profile stocks that have been swept up in market euphoria. Eventually the market rediscovers the good qualities of the out-of-favor stocks and lets the highfliers fall back to earth.
Dreman is most associated with the contrarian investment style through his books, long-running Forbes column and money management activities. Dreman’s “Contrarian Investment Strategies: The Next Generation” (Simon and Schuster, 1998) presents a number of measures for identifying contrarian stocks and provided the basis for the AAII screen discussed here.
Dreman believes that for an investment approach to be of value, it must take into account both the interpretational and behavioral obstacles of investing. Interpretational obstacles include the difficulty of actually estimating future company value, while behavioral obstacles deal with the emotional and psychological influences on our decision-making process. In the long term, the stock market’s success is determined by probabilities and odds, not luck. These probabilities are built upon investor behavior or psychology that pushes people away from rational behavior.
All of the advances in finance have not helped analysts provide more accurate earnings estimates, a key element in valuation models. Dreman has studied earnings surprises and their effect on stock prices using data going back to 1973. Missing an analyst estimate by a few cents can send a stock price down sharply. Positive earnings surprises occur when actual reported earnings are significantly above the forecasted earnings per share. Negative earnings surprises occur when reported earnings per share are significantly below the earnings expectations.
Dreman finds that the best way to take advantage of the high rate of analyst forecast error is to simply invest in out-of-favor stocks. In his studies of earnings surprises, Dreman found that stocks with low price-earnings (P/E) ratios reacted more strongly to positive earnings surprises than did high price-earnings stocks. As it turns out, a positive earnings surprise for a stock with high expectations (as measured by factors such as high price-earnings ratios) is not truly a surprise. It is a reinforcing event that does not change perceptions about a stock.
Dreman developed a number of interesting strategies to select stocks using the contrarian approach. For this screen, we combine a basic contrarian screen with an earnings estimate revisions screen.
The stock screen focuses on securities that have:
- Relative low price-earnings ratios
- Levels of liabilities to assets that are better than the norm for their industry
- Recent upward consensus earnings estimate revisions for the current and next fiscal year
The box below lists the specific filters used in the screen.
Performance
The AAII Dreman With Estimate Revisions screen is built into AAII’s Stock Investor Pro fundamental stock screening and research database. The companies meeting the criteria of this strategy each month are used to calculate hypothetical performance.
Figure 1 shows that the Dreman With Estimate Revisions approach has outperformed the S&P 500 index with a compound annual price gain of 14.7% over the period from January 1998 through September 2019, while the S&P 500 index is up 5.3% annually over the same period.
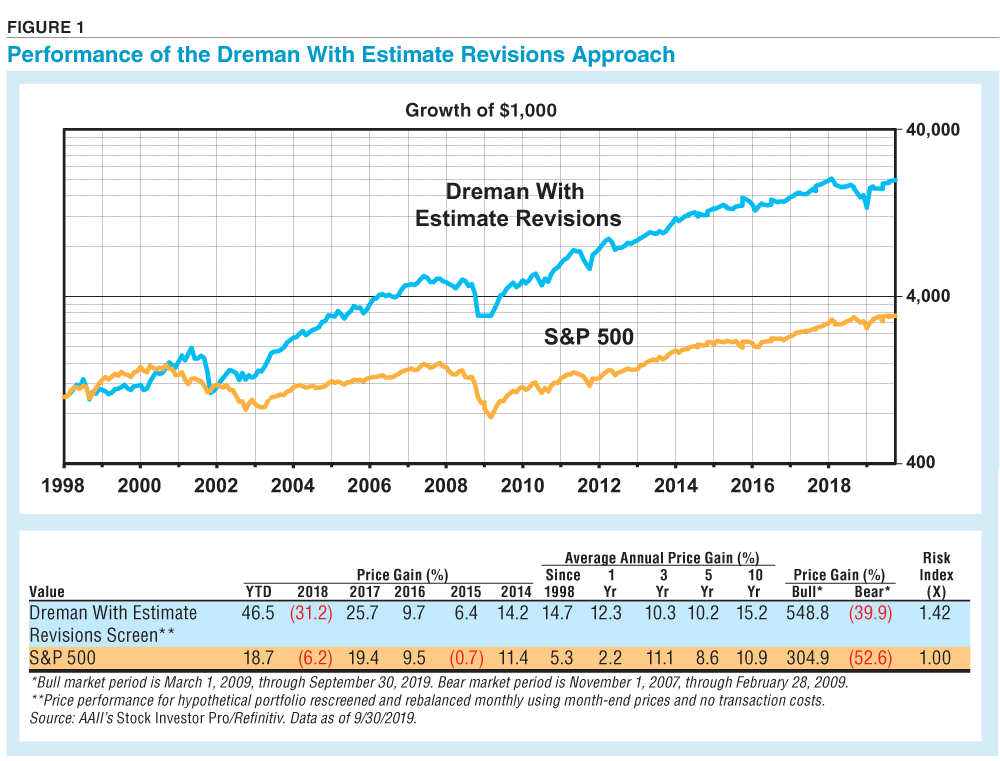
The strategy held up relatively well during the last bear market (November 2007 through February 2009), down 39.9% versus a loss of 52.6% for the S&P 500. The strategy has also outperformed during the subsequent bull market (March 2009 through September 2019) gaining 548.8% compared to cumulative price gain of 304.9% for the S&P 500.
The Dreman With Estimate Revisions screen has been 1.42 times more volatile than the S&P 500. It has strong 46.5% price gain this year through September, but it lost 31.2% last year. Dreman warns that investors repeatedly jump ship on a good strategy just because it hasn’t worked well lately, and, almost invariably, abandon it at precisely the wrong time.
You can follow the AAII Dreman With Estimate Revisions strategy’s performance, and see how it compares to the 59 other stock approaches that AAII tracks, at the Stock Ideas area of AAII.com.
Profile of Passing Companies
Dreman warns not to let the valuation process become too complex. Valuation models such as the dividend discount model are theoretically sound but provide a dangerously false level of precision. Simple valuation techniques based on price-earnings ratios and dividend yields are easy to work with and have been proven effective in numerous studies.
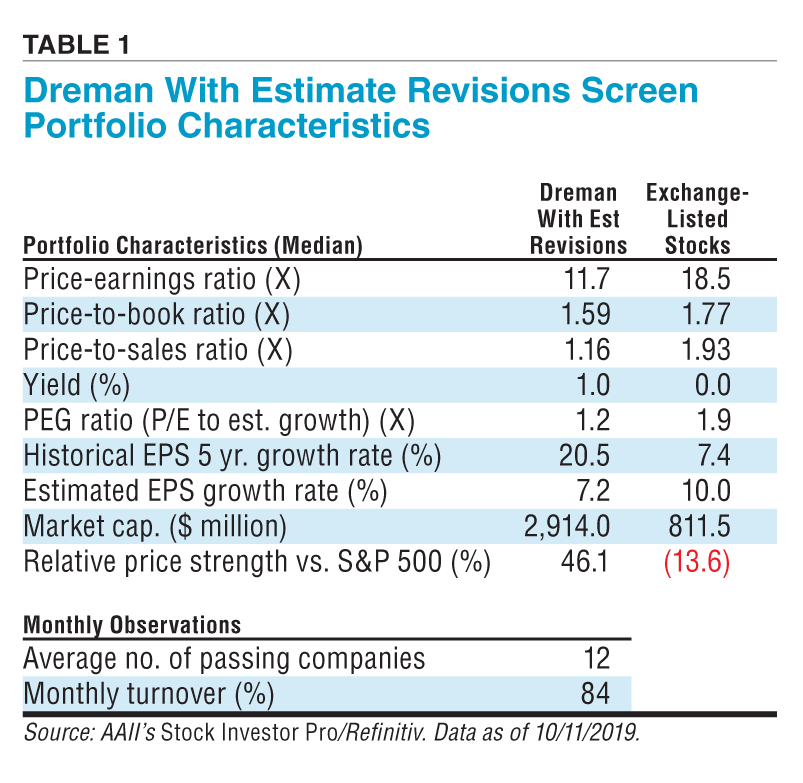
As illustrated in the characteristics of the stocks currently matching the Dreman approach (presented in Table 1), the median value of the price-earnings ratio of 11.7 is below the 18.5 median value of all exchange-listed stocks.
Dreman also favors large- and medium-sized companies in his approach for three primary reasons—greater chance for a rebound if there is a company misstep, greater market visibility with the rebound and a reduced chance of “accounting gimmickry.”
Stocks of rebounding larger companies tend to be in the public eye and get noticed more quickly when things go better for the company. This should result in a higher valuation for a given level of earnings. An increase in earnings coupled with an increase in the multiple which investors are willing to pay for a given level of earnings translates to significant price increases.
The companies passing the screen have a median market cap of $2.914 billion compared to the $811.5 million median of the overall stock universe.
Looking at Table 1, the stocks currently meeting the Dreman screen have a median five-year historical earnings growth rate of 20.5%, compared to 7.4%, for all exchange-listed stocks. The median estimated earnings growth rate of these low-priced passing companies is 7.2%, while for all exchange-listed stocks it is 10.0%.
Passing Companies
Dreman prefers to start the analysis among the bottom 40% of stocks according to price-earnings ratio. This typically provides a broad enough universe from which to perform the complete analysis.
Seven securities met the Dreman With Estimate Revisions criteria as of October 11, 2019. They are listed in Table 2 ranked by price-earnings ratio in ascending order. The current number of passing companies—seven—is less than the historical monthly average of 12.
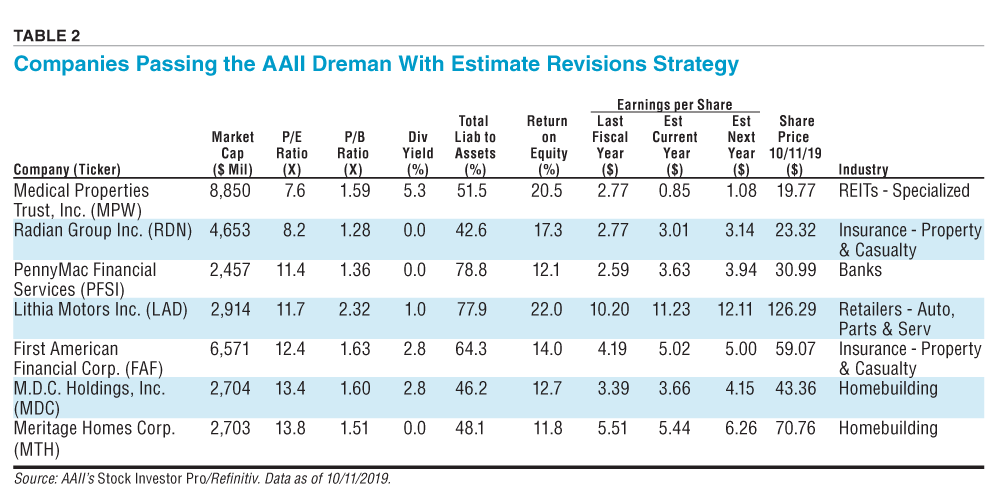
Interestingly, Medical Properties Trust Inc. (MPW) sports the lowest price-earnings ratio, but it’s a real estate investment trust (REIT) that focuses exclusively on providing capital to acute care facilities. Medical Properties Trust is also the largest passing stock with its market cap of $8.85 billion. Looking forward however, analysts are expecting annual earnings to drop, which would push up the price-earnings ratios closer to the market norm.
 Dreman feels that it is important to consider the financial strength of a company when pursuing a contrarian investment strategy. A strong financial position enables a company to work through a period of operating difficulty often experienced by out-of-favor stocks. Financial strength also helps to provide a measure of safety for the dividend payout. One must consider both the short-term obligations of the company along with long-term liabilities when testing for financial strength. We use the ratio of total liabilities to assets for our screen because it considers both short-term and long-term liabilities. Acceptable levels of debt vary from industry to industry, so we are screening for companies with total liabilities to assets below the norms for their industry.
Changes in estimates reflect changes in expectations of future performance. Since estimate revisions are often precursors to earnings surprises, we combined an earnings revision screen we had previously developed with the Dreman contrarian screen. As a preliminary step in the process, we filter out those firms with less than four estimates for the current fiscal year. This filter helps to ensure that revisions actually reflect a change in general consensus, not just a change by one or two analysts.
The next filter requires that the firm have an upward change over the course of the last month in its consensus estimates for the current and next fiscal year. We are also screening to make sure that no analysts lowered their estimates for the current or next fiscal year during the past month.
What It Takes: Dreman With Estimate Revisions Criteria
- Market capitalization is in the top 30% of all stocks for securities listed on the New York Stock Exchange;
- Market capitalization is in the top 15% of all stocks for securities listed on the American Stock Exchange, Nasdaq or traded over the counter;
- The price-earnings ratio is in the bottom 40% of all stocks;
- The percentage of total liabilities to total assets is less than or equal to the median for the primary industry of security;
- There are at least four analysts providing earnings estimates for the current fiscal year;
- The earnings estimate for the current and next fiscal year are greater than they were one month ago;
- At least one analyst has increased their earnings estimate for the current fiscal year and the next fiscal year;
- No analysts have decreased their earnings estimate for the current fiscal year or the next fiscal year in the last month.
Conclusion
Dreman agrees with Benjamin Graham that investors pay too much for companies that appear to have the best prospects at the moment and react too negatively to companies considered to have the weakest prospects. This mistake tends to be a self-correcting process that contrarian investors can use to their advantage. The situation often reverses itself within a year. Investors seem to consistently pay too much for “visibility,” which Dreman defines as the present foreseeable future stream of earnings.
 It is ironic that the “best” companies often seem to make the worst investments, while the “worst” companies can be the best investments. Too many investors trying to find the next hot stock overbid for the best prospects. Dreman says to succeed, avoid high price-earnings ratio stocks and be careful about new issues with little substance that often go public only in rising markets when the speculative fever is high.
Keep in mind that no matter how well a stock screening methodology has performed (or how badly it has underperformed) over the long term, stock screening is only the first step in the stock selection process.
You will want to do your homework to see why these companies are at their current levels. Only then will you gain insight into those that will continue to languish and those that may eventually flourish.
The stocks meeting the criteria of the AAII Dreman With Estimate Revisions approach do not represent a “recommended” or “buy” list. It is important to perform due diligence to verify the financial strength of the passing companies and to identify those stocks that match your investing tolerances and constraints before committing your investment dollars. Keep in mind that the quantitative screens we have developed are based upon our interpretations of published works tied to the market gurus.

Related

AAII Stock Ideas
David Dreman’s Contrarian Approach to Stock Selection
Related

Investor Professor
Earnings Estimates
Discussion
FREE REPORT

Get your free copy of our special
report analyzing the tech stocks
most likely to outperform the
market.
Matt Brown from Florida posted over 6 years ago:
Ed from TX posted over 6 years ago:
Tom from Ohio posted over 6 years ago:
You need to log in as a registered AAII user before commenting.
Log InCreate an account