

Charles Rotblut leads a class in AAII's new Essential Investing Video Course. Go to https://www.aaii.com/ves for more information and to subscribe.
Editor’s note: University of Chicago finance professor Lubos Pastor has studied political cycles in relation to stock market returns. We spoke at the 2019 AAII Investor Conference about how the markets perform when a Democrat or a Republican occupies the White House.
—Charles Rotblut, CFA
You have looked into the relationship between the party affiliation of U.S. presidents and market returns. Could you provide an overview of what you found?
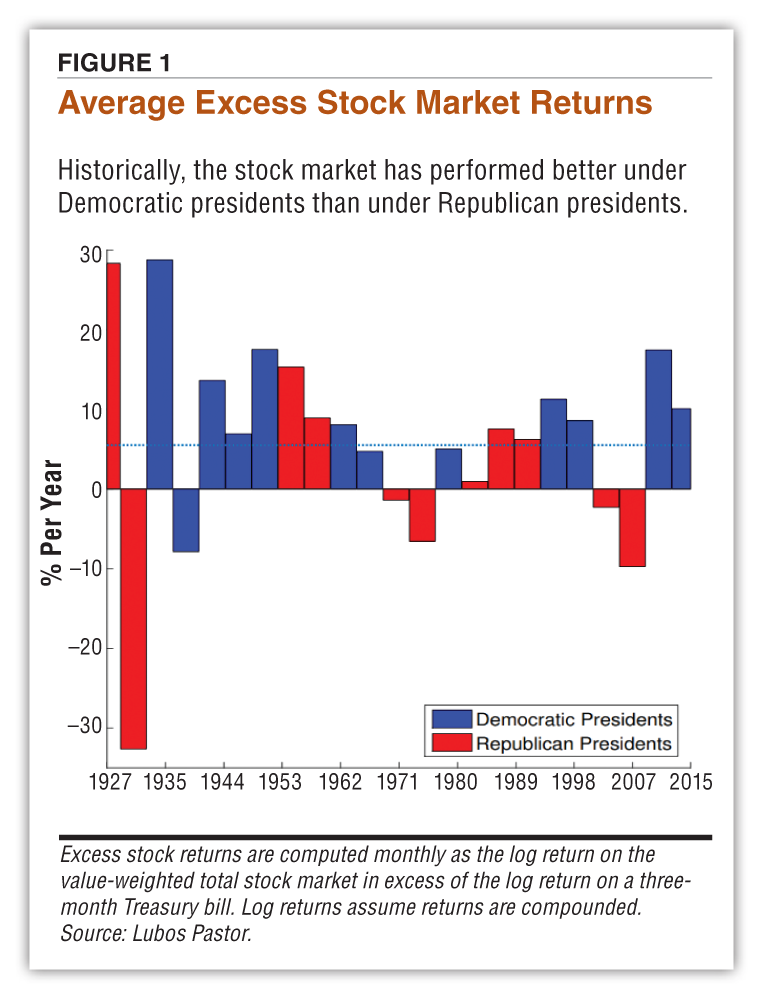
There’s this interesting historical fact that the stock market has done much better under Democratic presidents than under Republican presidents. In the 2019 paper, “Political Cycles and Stock Returns,” which I co-authored with Pietro Veronesi, we provide more evidence on this topic and try to get at why that is the case.
This backs up other findings of the market historically doing better when a Democrat occupies the White House than a Republican. Is there a presidential cycle at play?
Yes, we believe there’s a presidential cycle to this. It’s often referred to as the “presidential puzzle,” meaning we don’t know why the market performs better under Democrats than under Republicans.
It might sound puzzling because many people believe Republicans are the pro-business party. Republicans like to cut taxes, deregulate and support businesses. Democrats, not so much. But our explanation is that it doesn’t have much to do with what presidents actually do. It’s all about when presidents get elected.
In terms of the cycle, your research shows that the second year of a president’s term seems to be the weakest when you look at the year-by-year returns.
The first year of a president’s term is the strongest. Then it’s less clear what the pattern is like. The patterns in years one and two are still stronger than the pattern across all four years. In year one, there’s a 37% difference per year between Democrats and Republicans. Then the difference kind of goes down to 11% per year if you average it across the whole cycle.
What causes the change? Is it the economy? Is it risk aversion?
Our story is like a reverse causality. Instead of arguing that Democrats are somehow good for the stock market and Republicans are somehow bad for the market, we make a different point. We argue that Democrats tend to get elected in times of trouble, while Republicans tend to get elected in good times.
Consider the example of Barack Obama getting elected in November 2008. This was in the middle of the worst financial crisis in 50 years—the worst crisis since the Great Depression. And, of course, we got out of the crisis about 18 months after it started, and that’s why stock returns were really high in the first year of Obama’s term. After that, there was less going on.
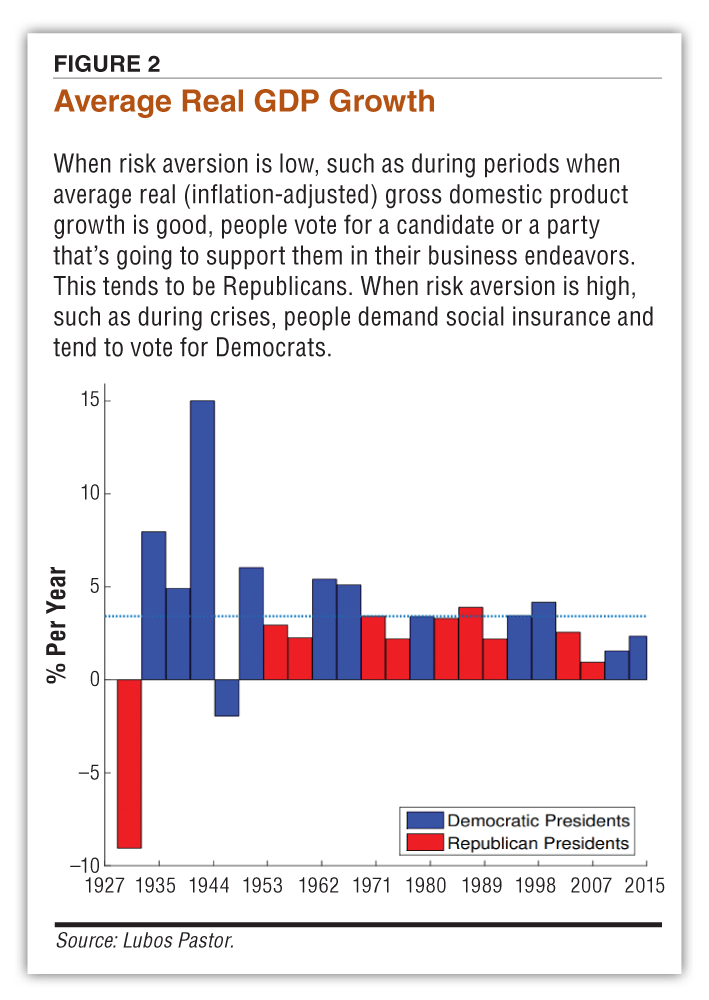
Essentially, in our story, what happened is that risk aversion was really high in the fall of 2008 during the financial crisis. When risk aversion is really high, people demand social insurance. This leads them to elect a Democrat. Then, as we get out of the crisis over the next year or so, risk aversion reverts to kind of a normal value.
And then on the flip side, at some point we get to a position where risk aversion is really low, like in a boom when the economy is thriving. When risk aversion is low, people are keen on starting new businesses. In an environment like that people vote for a candidate or a party that’s going to support them in their business endeavors. That tends to be Republicans. This means a Republican gets in at or near the peak when everybody’s happy. And then no matter what the president does, expected returns are lower going forward. As you know, from the peak, the market can’t really go higher.
That’s our story. Even if a president does nothing—even if they just play golf for eight years—you’ll find this effect.
So, the year-one performance can be reversed by year two. It’s just a matter of when the peak occurs and the market goes down, or when the trough is reached and the market rebounds.
Precisely.
It’s the peak or the trough that’s driving the preference toward the party affiliation of the candidate. The market results follow afterward.
Exactly. And it’s more driven by the troughs than by the peaks. Because when you’re in a crisis, you tend to get out of the crisis within a year or so. Whereas when you’re at a peak, you can actually stay there for a while.
As you are likely aware, some peaks are kind of flat. They last a long time. Whereas crises like the Great Depression or the Great Recession last for months, occasionally years. Crises tend to be shorter than booms.
With the Republicans that have been reelected—Ronald Reagan, George W. Bush, Richard Nixon, Dwight Eisenhower—the economy was still good when they were reelected. Did you find any relationship between the economy and the party affiliation of who got reelected?
We didn’t really see much in the pattern of reelections. Most of the action is in transitions from one presidency to another.
In fact, and even within that, most of the action is in transitions from Republicans to Democrats. So, basically, what’s happening if you look at the data is that we tend to have crises happen under Republicans.
When that happens, people go for a Democrat. And that’s the main thing. It happened in 1932 when Herbert Hoover, a Republican, was replaced by Franklin Delano Roosevelt, a Democrat. It happened in 2008 when George W. Bush, a Republican, was replaced by Barack Obama, a Democrat. It happened in 1976 when Gerald Ford was replaced by Jimmy Carter. It happened in 1992 when George H.W. Bush was replaced by Bill Clinton after a recession in 1991. So that’s the key pattern that is driving the results—the empirical pattern.
You also found a difference in preferences between the entrepreneurs and a group you refer to as “government workers.” That group includes …
Any net tax beneficiaries. Roughly half of the people are net tax beneficiaries, meaning they get more from the government than they pay in. We call them government workers.
Roughly half of the people are net taxpayers. They pay more in than what they get out. We call them entrepreneurs.
Somebody on Social Security is a net tax beneficiary, as they get more from the government than they put in. Children are government workers. The judiciary, public school teachers, the armed forces, police officers—these are all government workers in our model.
In our model, there is a very strong link between your job—whether you’re a net taxpayer or tax recipient—and how you vote. Essentially net taxpayers vote Republican and net tax beneficiaries vote Democrat.
To clarify, an entrepreneur doesn’t mean just those who start businesses but also those who work in the private sector with enough income to not rely on social services.
Somebody running a business is the best example. But I’m also happy including as entrepreneurs those who work for a private sector company and pay more in taxes than they receive.
Given this, would the change in the employment rate be a signal you could look at?
In general, looking at how people change jobs doesn’t really help much because, for our model, all you need is the median voter changing their job. There are approximately 330 million people and most elections have votes that are kind of close to a 50/50 split.
So, all you need is the median voter deciding, “I’m going to change jobs.” The change in jobs doesn’t have to be “I was a music teacher and now I’m going to start a business.” The change in jobs could be “I’m 63, I’m running this business and I’m thinking about when to retire. Under the 25% tax rate that I’m facing now, I’m happy working. If the tax rate were to rise to 30% under a new president, I would prefer to retire.”
That’s like changing jobs. You just need one person to go through that process.
What data should someone look at to identify such a trend? Obviously, news about a financial crisis could signal a change in leadership, but retirement trends are different.
The measurement here is simple. You just look at who’s in the White House.
If a Democrat is in the White House, it tends to mean that at least sometime recently the economy was poor. And if a Republican is in the White House, it tends to mean that sometime recently the economy was doing really well. It’s the economy that determines future stock returns; it is not who’s in the White House.
So, if we’re in a crisis and for some reason we don’t elect a Democrat—it has never happened, but it could—it might be a scenario where an incompetent Democrat runs against a competent Republican. In that case, people would go for the competent Republican. Returns would be expected to be higher under that competent Republican. But again, it has nothing to do with what presidents do. It’s all about when they get elected and who tends to get elected.
It’s not a 100-to-zero type of thing. In bad times, a Democrat is more likely to get elected. It’s not certain that they’ll get elected. They’re just more likely to win if they are running as a Democrat and there is a crisis.
You asked about signals; just to circle back to your question, the true signal is the economy—how the economy is doing. Who’s in the White House just happens to be a byproduct of how the economy is doing according to our model.
You also found the relationship between the economy and who gets elected to Congress to not be as strong.
If you sort time periods based on who controls Congress, there’s no result.
In your paper, you said favoritism toward one’s current representative and senators may be different than that toward the president.
I think the election of the president is very visible. It’s national. According to our model, it reflects the risk aversion of the whole nation. Congressional elections tend to be more about local issues.
In this presidential puzzle, if the higher returns during the Democratic administrations were caused by what presidents do, you would expect Congress to matter. Because the president needs Congress to enact their policies. But in our story, it’s not what presidents do. It’s all about how people feel. If people feel risk averse, then they elect a Democratic president. The president’s policies don’t matter, so it doesn’t matter whether they have Congress behind them or not.
Regarding risk aversion, how are you defining it in this context?
In our model, it literally is an aversion to risk.
It has to be because when risk aversion is high people demand social insurance. That’s why they vote for the party that’s more likely to provide the social insurance, the Democrats. When risk aversion is low, people are more likely to take on business risks, so they vote for the party that’s more pro-business—that’s the Republican party.
When you look at the data, you have to take into account the fact that risk aversion is highly correlated with the economy. When you’re in crisis, risk aversion tends to be high. When you’re in booms, like we experienced in the 1990s, risk aversion tends to be low.
So obviously, with the troughs, you have high risk aversion. As the economy improves, risk aversion changes, at which point the party affiliation of the president will change.
Correct.
Since many of our members will be curious, I’ll put you on the spot by asking what your model says about the outcome of the 2020 election.
President Donald Trump is a somewhat unusual president, as we all know. There’s a lot more going on than just the economy. Our model is an economic model.
There are so many other things that matter, and I think those other things are more important today than they are for a typical president. That makes it harder to predict what’s going to happen in 2020, because we are a bit further from our model given the various noneconomic influences: impeachment, immigration, etc. These things are relatively more important than they are otherwise.
If I went strictly through the lens of our model, I would say that we have a Republican in office who was elected when we had a strong economy, and in a strong economy Republicans tend to get elected.
Stock prices were also high when Trump came in, which means expectations going forward should be relatively low. So strictly speaking, our model predicts relatively low returns in the stock market going forward. But I would use this caveat: President Trump is not a typical Republican president.
For individual investors reading this, do you have any suggestions on how they might want to think about incorporating your findings into a portfolio?
I would just adjust expectations accordingly. Your portfolio, obviously, responds to the inputs about your expectations for future returns.
In your older papers, I noticed your discussion about stocks being more volatile over the long run. It seemed that the conclusion was based on investor perception of volatility. Am I reading that right?
There’s a difference between historical volatility, which is looking backward, and future volatility. An investor looking back has seen stocks being less volatile in the long run because there is mean reversion in stock returns. Historically, if you held stocks for 10 years and I held them for one year, you faced less volatility per year than I did because of the long-term results.
Forward-looking investors have to measure volatility around an unknown average. That’s the key difference.
When you look at history, you know what the average return was over the past 50 years. So, you calculate volatility around that known mean, let’s say 7%. Looking into the future, you don’t know what the average return is going to be so you’re calculating sigma—the standard deviation of volatility—around that unknown mean. This means that the sigma estimates get bigger and bigger as you go further out.
If you compound at 6% a year and I compound at 7% a year, it makes little difference in a one-year horizon. It makes much more of a difference as the investment horizon increases. Compounding at different rates makes a bigger difference as you go further out. The idea is that as you go further out, you’re computing sigma around an unknown mean where that trend becomes more uncertain, like 20 or 30 years out. The outcome is that stocks are actually more volatile in the long run than in the short run.
Because of the unknown.
Because of the uncertainty about the mean. The difference between history and the future is the uncertainty about the trend, about the expected return.
In your studies about liquidity—the ease of selling assets at or near quoted prices with relative ease—was the focus on how easy it is to use certain strategies, or was it based on how liquid an investment is, say, in a crisis?
We think of market liquidity as a risk factor. Just like the stock market is a risk factor in the capital asset pricing model (CAPM).
When market liquidity is low, those are bad times. That’s how we define liquidity beta in our older paper. We say every stock, every portfolio, has a liquidity beta, which reflects the covariance of that asset with market-wide liquidity. And assets that have high liquidity beta are highly sensitive to fluctuations in liquidity, so those are the riskier assets.
We constructed a liquidity index, which we’ve been updating every year. We plot it, we see how market liquidity develops over time, and then we use it as a factor. And we show that stocks with high liquidity beta indeed earn higher average returns than stocks with low liquidity beta. That was the case in 2003 when we wrote our paper, and that is the case today in 2019 when we went back and updated the study and added almost 20 years of data. The result is stronger out of sample than it was in sample.

Related

Portfolio Strategies
For Long-Term Investors, the Focus Should Be on Risk
Related

Stock Strategies
Do Elections Sway the Markets? Watch the Fed Instead
Discussion
FREE REPORT

Get your free copy of our special
report analyzing the tech stocks
most likely to outperform the
market.
Bob from WI posted over 6 years ago:
Joe L from Pennsylvania posted over 6 years ago:
Don W from Virginia posted over 6 years ago:
Sudutoo from WA posted over 6 years ago:
Sudutoo from WA posted over 6 years ago:
Charles Rotblut from IL posted over 6 years ago:
Ron McGrath from TX posted over 6 years ago:
Greg Waradzin from RI posted over 6 years ago:
John Di Marco from New Jersey posted over 6 years ago:
Steve Rawlinson from California posted over 6 years ago:
JEFF P from CA posted over 6 years ago:
ROSS H from AZ posted over 6 years ago:
You need to log in as a registered AAII user before commenting.
Log InCreate an account