



Related

Portfolio Strategies
A signal to rebalance one of our model portfolios was given following last year’s big run up in large-cap stocks.

Charles Rotblut leads a class in AAII's new Essential Investing Video Course. Go to https://www.aaii.com/ves for more information and to subscribe.
For the first time since the end of 2013, our non-withdrawal rebalancing model issued a signal to adjust portfolio allocations back to their target levels. This signal came following last year’s big run up in large-cap stocks and the comparative lower cumulative returns of bonds over the past six calendar years.
 The signal is not a call on where the market is headed but is rather a sign of the models’ allocations veering too much off target. It does provide an opportunity to talk about what rebalancing is designed to do, to discuss the potential tax impacts of rebalancing using actual dollar amounts and to compare and contrast the returns of domestic stocks, international stocks and bonds.
Before going into the details, here are a few takeaways:
Before explaining each of the bullet points further, I want to provide some background and updates about the models used for this analysis. Many of you who have been following these annual updates may find this section to be a useful refresher. Those of you who are new to them will have a better understanding of what’s being discussed by reading this brief section.
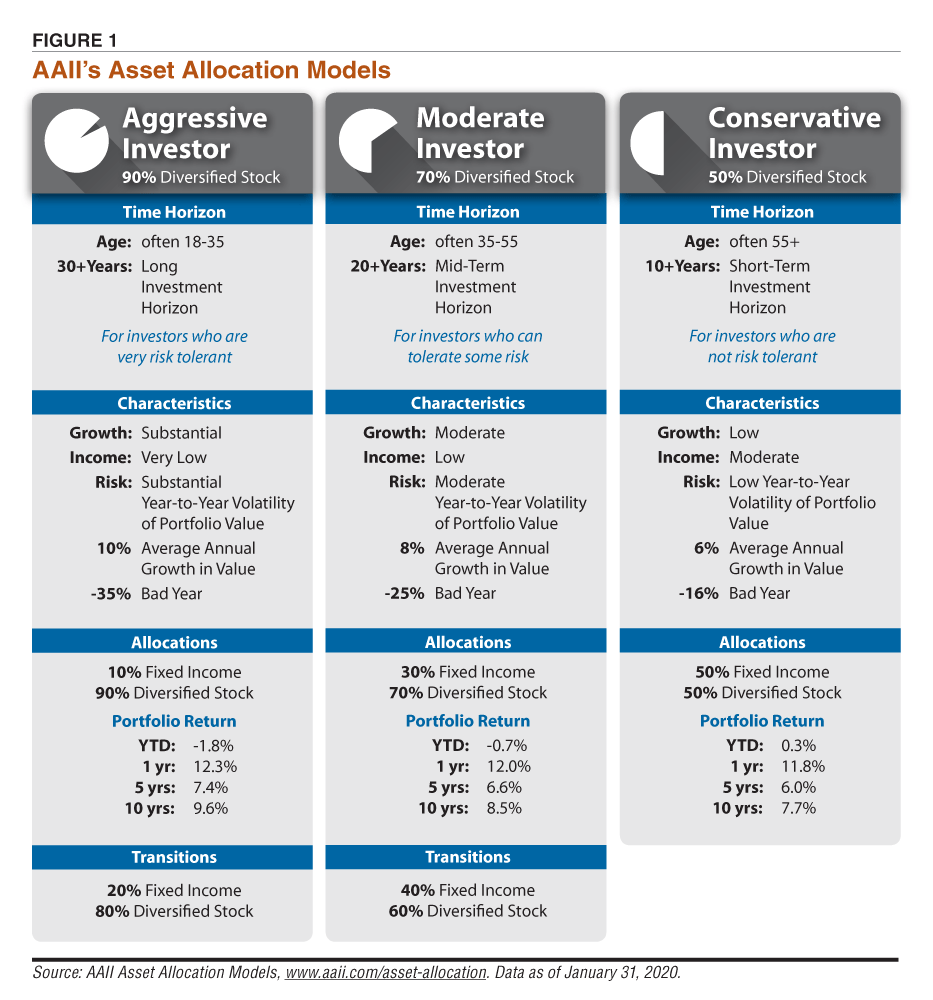
Since 2011, I’ve been conducting an ongoing analysis of hypothetical portfolios based on AAII’s moderate asset allocation model. This model calls for allocating 70% to a diversified collection of stocks and 30% to bonds. For the stock portion, the target allocation I’ve used is 20% in large-cap stocks, 20% in mid-cap stocks, 10% in small-cap stocks and 20% in international developed country and emerging market stocks. See Figure 1 for an illustration of the investor characteristics for the moderate allocation model, as well as the characteristics for two other AAII asset allocation models—aggressive and conservative.
The hypothetical portfolios are either non-withdrawal or withdrawal. No withdrawals are taken out of the first one (the “non-withdrawal” portfolio). The second, the “withdrawal” portfolio, assumes a retiree makes annual withdrawals based on an inflation-adjusted 4.5% rate. (The withdrawal rate is discussed in more detail later in this article.)
The allocation for the non-rebalanced portfolios was established at the beginning of the study. No additional changes are made to the portfolios. Rather, their allocations evolve based on the weighted performance of each fund held. The rebalanced portfolios are periodically adjusted back to their targeted allocations whenever the weighting of any single fund is more than five percentage points above or below its target. The 5% band is based on a Vanguard study (“Best Practices for Portfolio Rebalancing,” May 2011 AAII Journal).
The hypothetical portfolios use Vanguard funds to replicate the returns an investor could have realized after fund fees are factored in. The Investor Shares class of funds was used for the period of 1988 through 2017. The Admiral Shares class of funds was substituted in 2018 because Vanguard stopped offering the Investor Shares class to most investors. Part of the goal of this study is to show the returns an investor could have realized in a real-world portfolio, gross of taxes and specific account fees (such as those charged by a workplace retirement plan). For this year’s update, we added an estimate of the capital gains in response to member questions regarding the tax impact of rebalancing.
A start date of 1988 was used because it was the first full year that return data was available for some of the funds used in the models. The models are updated annually using end-of-year return data. Spreadsheets with the full data and a thorough explanation of the calculations are linked in the online version of this article.
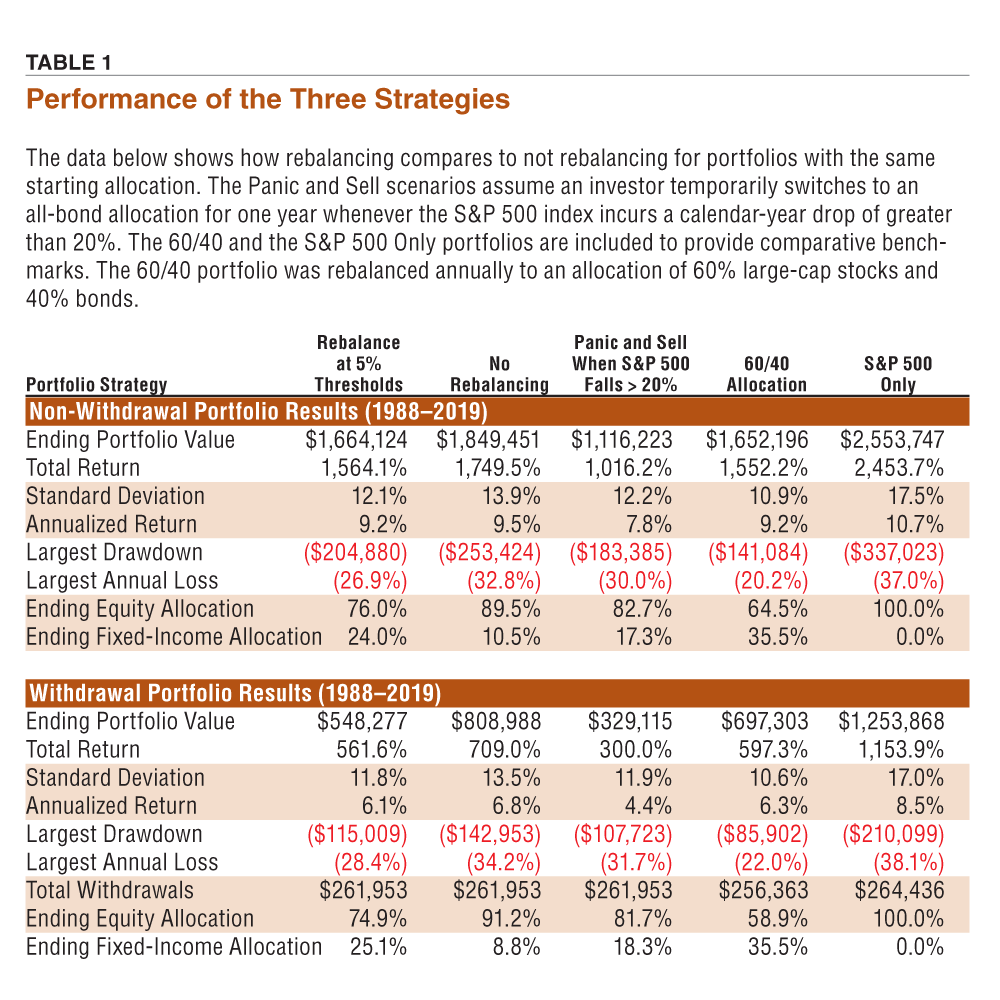
Two types of portfolios are presented in Table 1 to account for different life-cycle stages readers may be in. Non-withdrawal portfolios have no outflows. The hypothetical portfolios are treated as being fully funded at their inception dates with the dollars invested allowed to grow over time.
Withdrawal portfolios are akin to those held by a person in retirement who is taking withdrawals to fund living expenses. A 4.5% inflation-adjusted withdrawal rate is used. This is the withdrawal rate suggested by retired financial planner William Bengen. Bengen created the widely followed 4% withdrawal rule. He later determined a higher withdrawal rate of 4.5% of portfolio value could be used with a diversified portfolio.
To provide some context on the difference, a 4.5% inflation-adjusted withdrawal rate used with a starting value of $100,000 would have provided a retiree with cumulative income of $261,953 over a 32-year period. A 4% withdrawal rate would have provided $232,847 of income over the same period with the same starting balance.
The difference in cumulative withdrawals does not equal the difference in ending wealth because of the frequency with which the withdrawals were taken. Every time a withdrawal is taken, there is less money in the portfolio to benefit from positive investment returns (or be hurt by negative returns). The annual withdrawals have the effect of gradually reducing how much money is left in the portfolio to grow. At the same time, the 4.5% withdrawal rate leads to increasingly larger dollar amounts being distributed than the 4% withdrawal rate because the starting value is larger. Every inflation adjustment for the portfolios based on our allocation model is based on a starting value of $5,181 for the 4.5% withdrawal portfolio and a starting value of $4,605 for the 4% portfolio. (Each portfolio started with $100,000 that appreciated to $115,129 at the end of its first year in 1988.)
Be aware that the withdrawal rate is a separate decision from whether or not rebalancing is used. Though the allocation that is selected, the decision to rebalance or not and the withdrawal rate chosen are all interrelated in terms of whether or not a retiree risks outliving their savings, for the purposes of this analysis, the same withdrawal rate is used for all withdrawal portfolios.
A signal to rebalance the non-withdrawal portfolio was issued based on data from the end of last year in 2019. This was the first time such an alert was issued since the end of 2013. It was also just the ninth such alert to be issued since the portfolio’s start date of January 1988.
Two of the portfolio’s holdings prompted the alert. The allocation to large-cap stocks, represented by the Vanguard 500 Index Admiral fund (VFIAX), rose to 25.7%. The target weight is 20%. The allocation to bonds, represented by the Vanguard Total Bond Market Index Admiral fund (VBTLX), fell to 24.0%. Its target weight is 30%. In both cases, the allocations rose above and fell below their respective five-percentage-point bands.
In total, three of the portfolio’s four stock funds have excessive weightings. The Vanguard Mid Cap Index Admiral fund (VIMAX) ended 2019 with a portfolio weighting of 23.1%, while the Vanguard Small Cap Index Admiral fund (VSMAX) had a portfolio weighting of 10.7%. Their respective target weights are 20% and 10%. The Vanguard Total International Stock Index Admiral fund (VTIAX) remained underweighted for another year with an allocation of 16.6%. Its target weight is 20%.
In total, the portfolio ended last year with an equity allocation of 76% and a bond allocation of 24%. Both are more than five percentage points away from the target of 70% stocks and 30% bonds. Hence, the need to rebalance.
We rebalanced the portfolio by paring down our positions in the S&P 500, mid-cap and small-cap index stock funds. The proceeds were then used to increase our positions in the international stock fund and in the bond fund. These actions adjusted the portfolio back to its targeted allocation of 20% large-cap, 20% mid-cap, 10% small-cap, 20% international and 30% bonds.
While there was a clear signal to rebalance the non-withdrawal portfolio, the decision was less clear with the withdrawal portfolio (whose last signal to rebalance was issued at the end of 2014). In this portfolio, the allocations were close to but technically not over the limits requiring rebalancing.
Large-cap stocks (VFIAX) accounted for 24.6% of the portfolio’s allocation at the end of 2019. Bonds (VBTLX) accounted for 25.1% of the portfolio’s allocation. If the portfolio’s bond allocation were modestly lower, a clear signal to rebalance would have flashed.
 The difference between the two portfolios is attributable to withdrawals. The non-withdrawal portfolio is a buy-and-hold portfolio. All money invested in it is assumed to stay within the portfolio. The withdrawal portfolio assumes annual withdrawals are being taken. These outflows have caused the allocations to evolve somewhat differently as time passed.
Whether a person chooses to rebalance the withdrawal portfolio depends on how strictly they want to follow the rules. Our quantitative model suggests not taking any action. In the real world where allowances are made for the messy nature of investing, a person may look at the bond allocation as being close enough to the five-percentage-point line to warrant rebalancing. Either decision in this scenario is acceptable. Rebalancing in this case would have been in keeping with the spirit of the strategy, while waiting would be indicative of strictly adhering to the rules. We chose the latter approach of strictly following the rules to continue using the same application of the rules we have been using since starting this analysis in 2011.
The need for rebalancing was due to the performance of large-cap stocks relative to bonds. Between the start of 2014 and the end of 2019, the Vanguard 500 Index Admiral fund nearly doubled in value. The fund gained 96.3% on a total-return basis over this time period. In comparison, the Vanguard Total Bond Market Index Admiral fund realized a total return of 22.2%.
This difference in returns caused the underlying weight of the portfolio to tilt toward large-cap stocks. Such a tilt is not unexpected because over time stocks outperform bonds.
The last six years were above-average in terms of large-cap performance, however. The Vanguard 500 Index fund realized an annualized return of 11.9%. This return not only had a direct impact on the returns of our model rebalanced funds but also on the more traditional 60/40 portfolio.
This latter portfolio uses a 60% weighting in large-cap stocks and a 40% weighting in bonds. It is rebalanced annually. Despite having a smaller equity allocation than our 70% stock/30% bonds rebalanced portfolio, it realized a higher return during the past six years: 8.6% versus 7.3% for the 70/30 rebalanced portfolio. This was directly attributable to the 60/40 portfolio’s bigger allocation to large-cap stocks.
The 70/30 rebalanced portfolio uses a more diversified stock portfolio. While the mid-cap and small-cap stock funds realized respectable annualized returns of 10.0% and 8.5%, they both lagged their larger-cap brother. The international stock fund fared much worse, realizing an annualized return of just 4.0% over the same period. Keep in mind the relatively short six-year period that these returns reflect.
Over the longer 32-year period, the 70/30 rebalanced non-withdrawal portfolio has a very slight performance edge over its 60/40 counterpart. The annualized returns are the same when carried out to one decimal point, but the ending wealth is slightly greater for the 70/30 rebalanced non-withdrawal portfolio. At the end of 2013, the rebalanced non-withdrawal portfolio had about an 8% advantage in total wealth. Put another way, the outperformance of large-cap stocks over the past six years allowed the 60/40 portfolio to essentially close the gap. However, there is no guarantee that this outperformance will continue in the future.
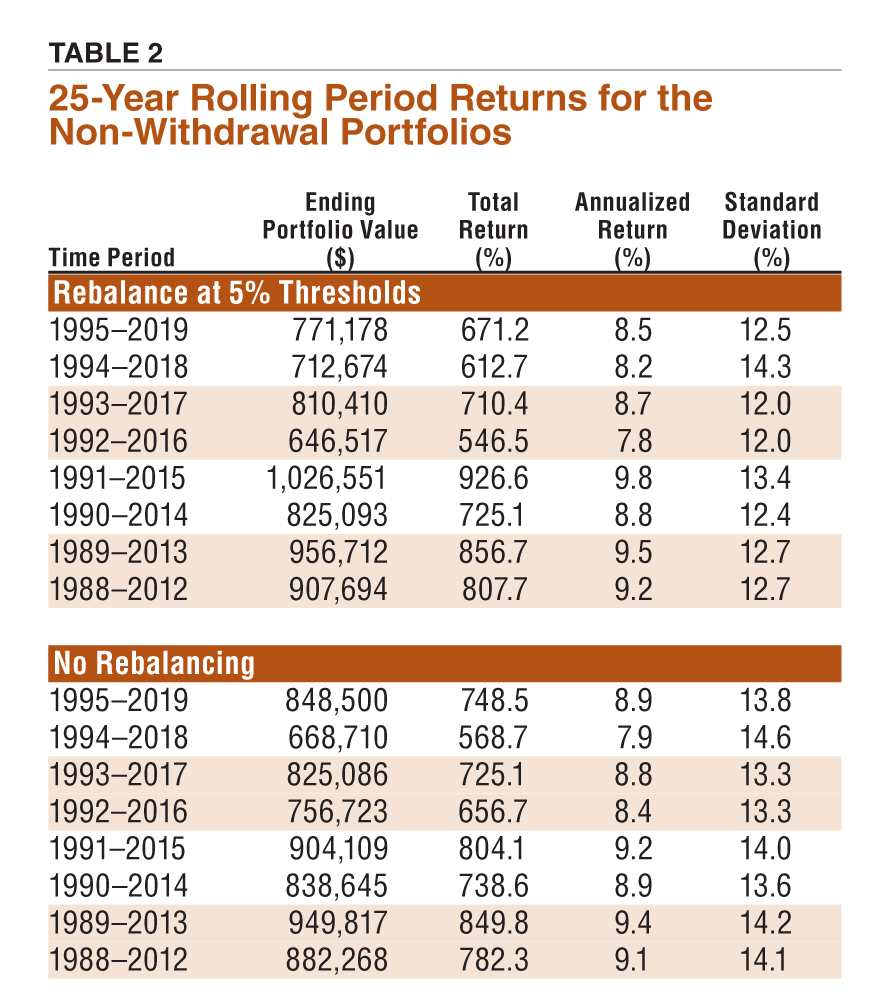
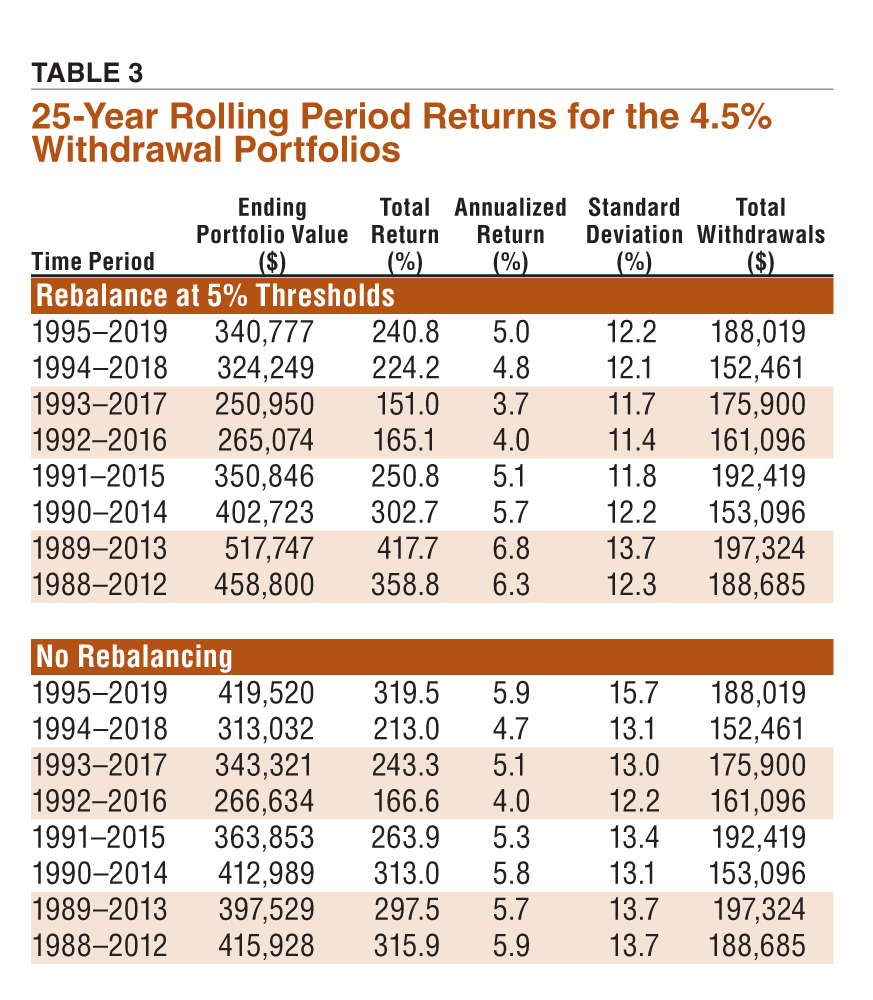
Returns are always sensitive to the time period in which they are calculated. Tables 2 and 3 show a comparison of returns over various rolling 25-year periods for the rebalanced and non-rebalanced portfolios for non-withdrawal and withdrawal scenarios, respectively. We’ve added returns for the period of 1995–2019 this year.
One question AAII members have asked over the years is how much of a tax impact rebalancing has. If rebalancing is done in a tax-preferred account—such as an IRA, a Roth IRA or a 401(k) plan account—there is no tax impact. If it is done in a taxable account, capital gains will be realized. These gains will be taxable if there are no offsetting losses to be applied against them.
To provide an estimate of the tax, we recreated the non-withdrawal portfolio with a starting date of January 1, 2014. A balance of $100,000 was used. The starting allocation was $20,000 in the S&P 500 fund, $20,000 in the mid-cap fund, $10,000 in the small-cap fund, $20,000 in the international stock fund and $30,000 in the bond fund. The allocations were left unchanged until rebalancing took place. The portfolio’s balance at the end of 2019 was $152,980.
The act of rebalancing required selling shares of the S&P 500, mid-cap and small-cap funds. These funds had balances of $39,260, $35,345 and $16,356, respectively. Paring each fund down back to its target allocation resulted in realizing capital gains of $8,664, $4,749 and $1,058 for tax purposes. An investor in the 15% capital gains tax bracket (income of $80,000 to $496,600 for married filing joint and $40,000 to $441,450 for single filers in 2020; they were $78,750–$488,850 and $39,375–$434,550, respectively in 2019) would have incurred a tax liability of $2,171 by rebalancing. Those subject to the 3.8% net investment income surtax would owe an additional $550 in taxes. (Note: These numbers exclude any fund distributions made over the past six years and assume long-term gains were realized on all shares sold. Investors can specify which lots are sold to avoid short-term gains on shares purchased through reinvested distributions. Your actual tax liability will depend on the allocation chosen, the amount invested, your tax bracket and the frequency at which you rebalance.)
These numbers assume periodic rebalancing. A wider threshold—say 10 percentage points off target instead of five percentage points—would result in fewer rebalancing events but potentially larger tax liabilities when rebalancing was required. Annual rebalancing would result in more frequent, but smaller tax liabilities. Whether the tax liability is justified depends on how much importance you place on maintaining your allocation. When weighing the tax aspect, realize that the decision not to rebalance will lead to greater volatility. If you are unable to psychologically handle the higher level of volatility, you could potentially incur the even greater cost of panic-selling.
The discussion in this year’s update focused on the signal to rebalance. This signal was specifically related to the portfolio’s allocation. Its sole purpose was to bring the portfolio’s allocation back to its target.
Though the signal resulted in the paring down of domestic stock funds and the reinvestment into international stock and domestic bond funds, it does not tell us anything about the future performance of the asset classes and categories these funds track. Rebalancing is not a tactical strategy. Its purpose is not to tell you when the right time to be in stocks and the right time to be in bonds is.
Rather, it is designed to reduce risk by keeping a portfolio’s allocation from going too far astray. By bringing the portfolio back to its target allocation, the benefits of the allocation strategy are realized over the long term. Not rebalancing can lead to an allocation that looks nothing like the investor originally intended. For example, the non-withdrawal, non-rebalanced portfolio ended 2019 with an 89.5% allocation to stocks—nearly 20 percentage points greater than the targeted allocation.
Periodic rebalancing using pre-specified thresholds can coincide with big market moves. Our models called for rebalancing at the end of 2002 and 2008, for instance. These signals were issued because the market had driven allocations too far off target, not because the model itself was predicting that a rebound in stock prices would soon occur. ?
 Downloads |
Portfolio Strategies

Portfolio Strategies

Portfolio Strategies

Tom from Texas posted over 6 years ago:
Charles Rotblut from IL posted over 6 years ago:
jeffrey sonshine from CT posted over 6 years ago:
Charles Rotblut from IL posted over 6 years ago:
Charles Rotblut from IL posted over 6 years ago:
steve from maine posted over 6 years ago:
Charles Rotblut from IL posted over 6 years ago:
Bryan G from IL posted over 6 years ago:
JOHN F from IA posted over 5 years ago:
CARL Z from MD posted over 5 years ago:
CHARLES R from IL posted over 5 years ago:
ROBERT A from NC posted over 4 years ago:
You need to log in as a registered AAII user before commenting.
Log InCreate an account