



Related

Small Cap Value Investing
The Model Shadow Stock Portfolio has more frequent bear cycles than the S&P 500, but the down periods have generally been shorter in duration and the bull reversals stronger.
Wayne Thorp leads a class in AAII's new Essential Investing Video Course. Go to https://www.aaii.com/ves for more information and to subscribe.
The S&P 500 index has fallen more than 25% from its February peak, marking an end to the record long bull market. The sudden and sharp market decline arrives as investors come to grips with the disruption that the coronavirus will have not only on the global economy but everyone’s day-to-day lives.
The strength of the S&P 500 during 2019, however, masked the weakness of many stocks since the fourth quarter of 2018. While the large-cap S&P 500 gained 31.3% during 2019, the average exchange-listed stock gained 14.8% during 2019.
The Model Shadow Stock Portfolio gained 19.6% during 2019, but that was not enough to overcome the 28.5% loss in the last four months of 2018. The portfolio has been in a bear market since the end of August in 2018.
Historically speaking, bear market durations are shorter than bull market runs. The stock market crash of 1929 resulted in a bear market that lasted 2.7 years. The collapse of the Bretton Woods system and associated bear market of 1973 to 1974 resulted in a 48.2% loss over 1.7 years. The bear market associated with the collapse of the dot-com bubble in 2000 lasted about two and a half years. The bear market from the financial crisis of 2008 saw stocks lose 56.8% over the course of one year and five months. On average bear markets over the last one-hundred years have averaged 1.6 years in length and have resulted in an average loss of 38.9%. Stock market bull runs have averaged 5.2 years with an average gain of 182.7%.
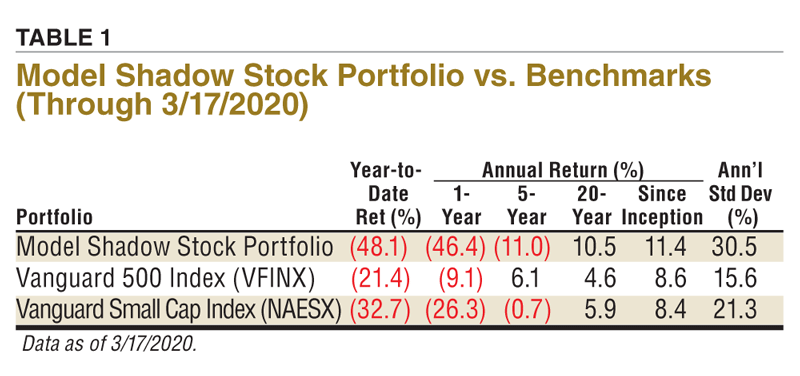
Over the last two and half months, the Model Shadow Stock Portfolio has declined 48.1%. In contrast, the S&P 500 as measured through the Vanguard 500 Index fund (VFINX) is down 21.4%, while the Vanguard Small Cap Index  (NAESX) is down 32.7% year-to-date through March 17, 2020. Table 1 shows the portfolio’s performance figures against these comparisons over various time periods. Table 2 shows the current holdings of the Model Shadow Stock Portfolio.
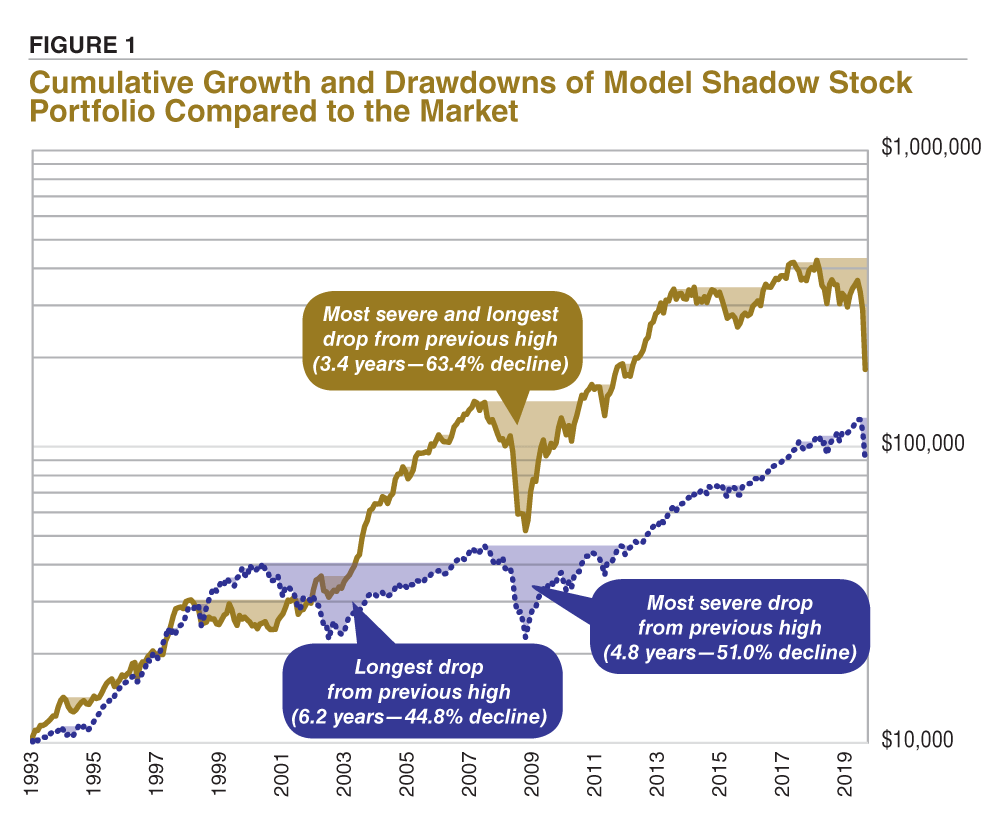
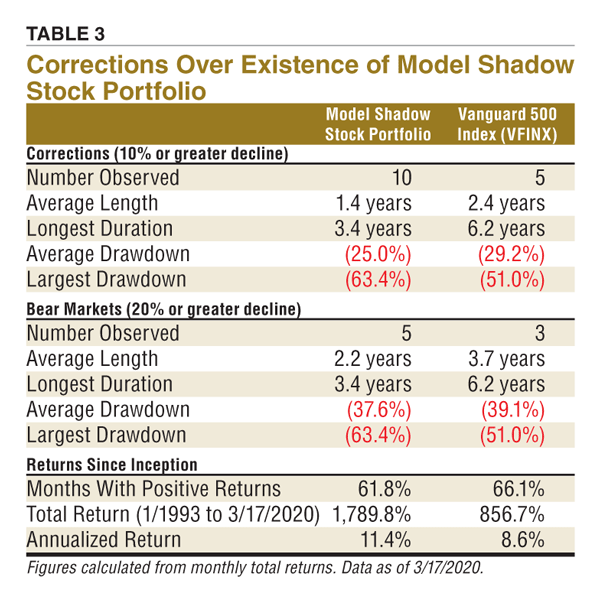
We examined the monthly total returns of the Model Shadow Stock Portfolio along with the Vanguard 500 Index fund to gain a sense of the frequency, duration and severity of corrections and bear markets over its 27-year history. Figure 1 shows the cumulative growth coupled with the drawdowns, which are shaded. The chart provides visual illustration of the severity and duration of the drawdowns for the model portfolio and Vanguard 500 Index fund, while Table 3 summarizes the data. The drawdown is the decline from prior high portfolio or market value. Drawdowns reflect the drop experienced during a bear market, but the duration is longer since the drawdown also reflects time needed before the full loss is recouped, not just when the downturn is reversed.
The Model Shadow Stock Portfolio has a cumulative total return of 1,789.8% (11.4% annualized) over its history, compared to the cumulative total return of 856.7% (8.6% annualized) for the Vanguard 500 Index fund. However, the greater long-term observed return has come with greater short-term volatility. On average, the Model Shadow Stock Portfolio has been up 61.8% of individual months during its existence. This means of course that it has had negative months around four out of 10 months. In contrast, the Vanguard 500 Index fund has had positive monthly returns 66.1% of the time, or down months 33.9% of the time over the same time period.
Corrections are generally classified as declines of 10% or greater. The Model Shadow Stock Portfolio has had 10 observed corrections, and five of them have turned into bear markets of 20% or greater. The average correction has been 1.4 years in length, with an average drawdown of 25.0%. The drawdowns in Table 3 are the maximum losses sustained during a given downturn. The duration is the time it takes the portfolio to return to its level just before the downturn began. The longest correction (July 2007 to November 2010) was 3.4 years and had a drawdown of 63.4%.
The Vanguard 500 Index fund has had five observed corrections and three of them have gone on to become bear markets of 20% or greater over the same time period. The average correction has been 2.4 years in length with an average drawdown of 29.2%. The longest correction (September 2000 to October 2006) was 6.2 years with a drawdown of 44.8%, but the greatest drawdown of 51.0% was with the 2007 bear market that lasted 4.8 years (November 2007 to July 2012).
As shown in Table 3 and Figure 1, the Model Shadow Stock Portfolio has more frequent corrections and bear market cycles than the S&P 500, but the down periods have generally been shorter in duration and bull market reversals stronger.
If you are tempted to time the market, we suggest that you consider the issues raised in our May 2018 Model Portfolios article titled “Model Shadow Stock Portfolio: Staying Invested All 12 Months.” The article examines the impact on your returns if you should miss one month during the year in the which the market has its best return. Market movements are often very sudden and strong both to the upside and downside. The biggest market up days are often clustered near the biggest market down days.
The next portfolio review will take place around the end of March, and any changes made then will be reported in the May 2020 AAII Journal. You can keep abreast of the Model Shadow Stock Portfolio on AAII.com at www.aaii.com/model-portfolios. To receive monthly email updates along with alerts to any changes made to the portfolio, please sign in to AAII.com and go to www.aaii.com/email. ?
Small Cap Value Investing
Small Cap Value Investing
AAII Model Portfolios

JAMES T from FL posted over 4 years ago:
You need to log in as a registered AAII user before commenting.
Log InCreate an account