


Related

AAII Model Portfolios
A look at the strongest and weakest months for the Model Shadow Stock Portfolio over its 27-year history.

As Jeffrey Hirsch noted in his AAII Journal article on season patterns, “those who study market history are bound to profit from it.” (“Using Seasonal and Cyclical Stock Market Patterns” June 2013).
It has been observed that small-cap stocks tend to outperform large-cap stocks during January, perhaps helped by year-end tax-loss selling that has a greater impact of temporarily depressing the prices of less-liquid small-company stocks in December.
We have certainly observed a “January Effect” with the Model Shadow Stock Portfolio. The portfolio has an average monthly return of 1.3% over its 27-year history, but during January, the average monthly return has been 2.0%, which is 1.3 percentage points above that of the S&P 500 index.
However, on average, March has been the strongest month for the Model Shadow Stock Portfolio. The portfolio has an average monthly return of 2.5% during March, compared to 1.5% for the S&P 500. Interestingly, February has been a relatively weak month for both the Model Shadow Stock Portfolio and the S&P 500, with a 0.9% and 0.3% average monthly gain respectively. Historically, August has been the weakest month over the last 27 years, with an average monthly return of negative 0.4% for the S&P 500 and a positive 0.2% average monthly return for the Model Shadow Stock Portfolio.
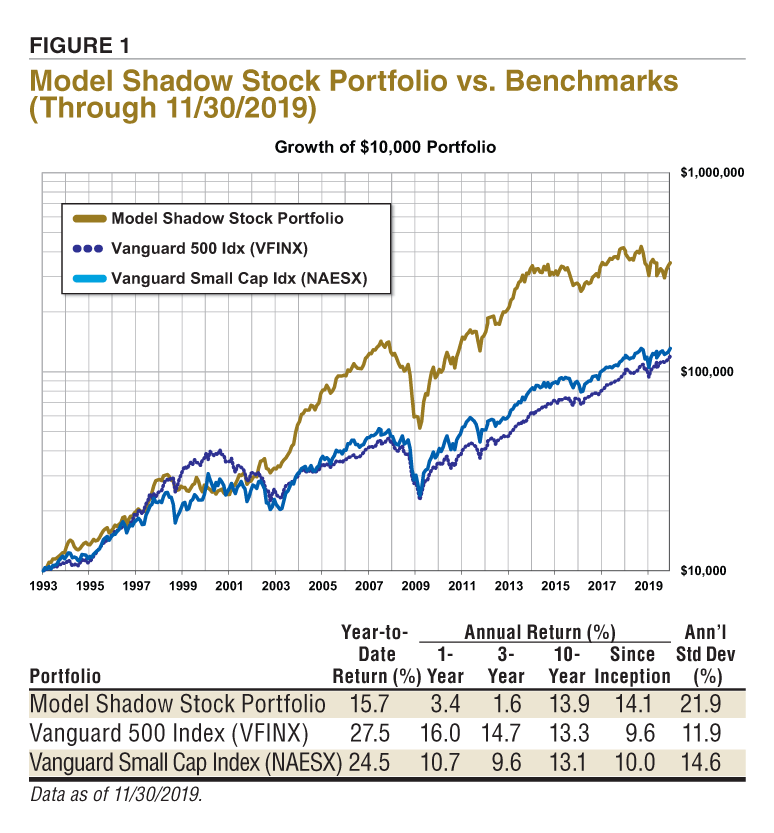
As the year was coming to a close, the returns of small-cap stocks continued to lag those of larger companies during 2019. The S&P 500 as measured by the Vanguard 500 Index fund  (VFINX) is up 27.5% for the year through the end of November, well above the 15.7% year-to-date return for the Model Shadow Stock Portfolio. Over its 27-year history, the Model Shadow Stock Portfolio has outperformed the S&P 500 during 16 calendar years, or 59% of the years.
It has been observed that while the returns of small-cap stocks tend to outperform those of large-cap stocks over the long term, they also tend to undergo periods of underperformance.
Since its inception in 1993, the AAII Model Shadow Stock Portfolio has a compound annual average return of 14.1% versus the Vanguard 500 Index fund’s annual return of 9.6%. Over the same period, the Vanguard Small-Cap Index fund (NAESX) posted an average annual gain of 10.0%. Figure 1 summarizes the long-term performance.
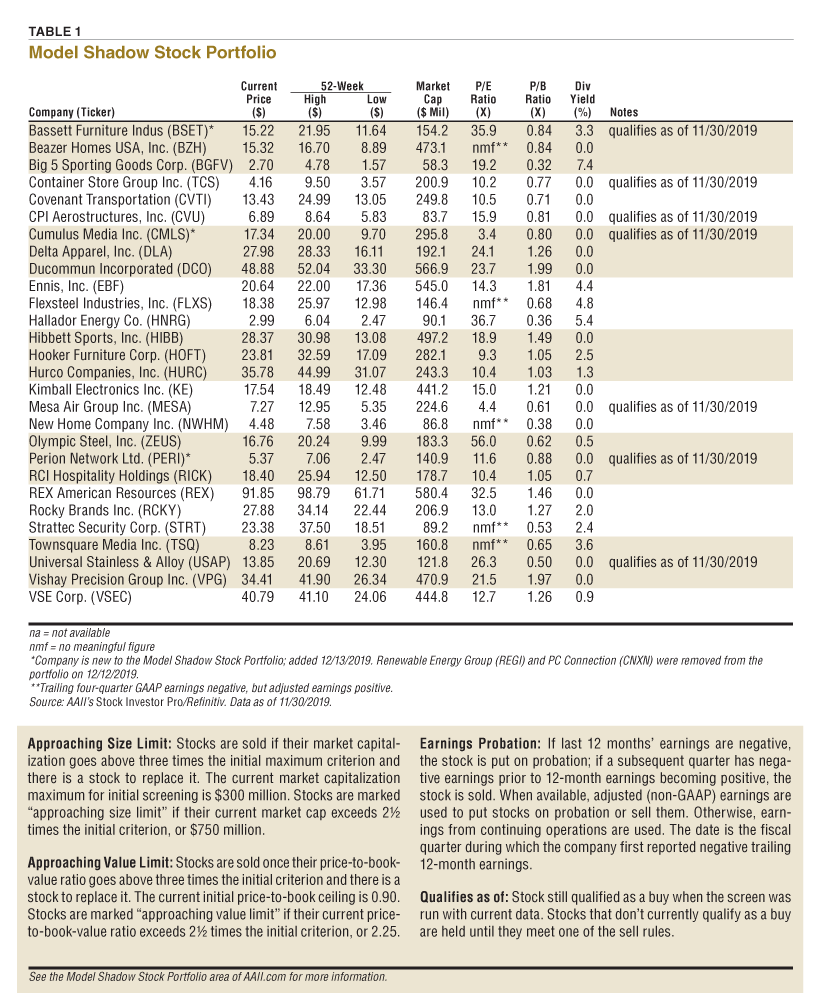
Table 1 shows the current holdings in the Model Shadow Stock Portfolio. The primary Model Shadow Stock Portfolio selection criteria target the intersection of the smallest 10% of domestic stocks as measured by market capitalization and the “cheapest” 10% of domestic stocks as measured by the price-to-book-value (P/B) ratio. These decile breakpoints are determined by examining domestic companies that are listed on the New York Stock Exchange (NYSE).
The analysis of the stocks listed on the NYSE led to an adjustment of the market cap criterion to an initial range of $30 million to $300 million, while the price-to-book ratio initial requirement was adjusted to a maximum value of 0.90. Stocks are removed from the portfolio if they have values that exceed the initial market cap or price-to-book ratio by a factor of three during the quarterly portfolio review.
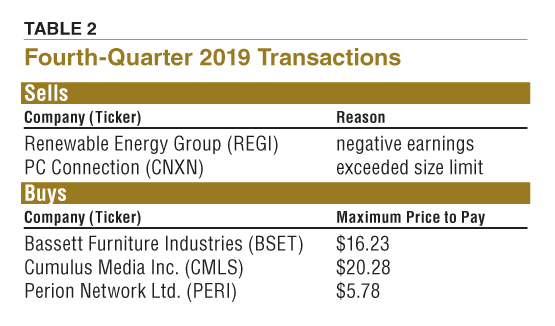
After conducting this quarter’s review of the Model Shadow Stock Portfolio in early December, two stocks were removed from the portfolio—Renewable Energy Group (REGI) and PC Connection (CNXN). Table 2 summarizes the changes. The detailed Model Shadow Stock Portfolio Rules box at the end of this article note the purchase and sell rules and provide some portfolio management rules as well as buy and sell tips.
Sold: Renewable Energy Group (REGI)
Renewable Energy Group has been on earnings probation since it announced its second-quarter 2019 earnings. On August 6, the company reported an adjusted second-quarter loss of $1.64 per share, which pushed the trailing 12-month earnings negative. On November 5, Renewable Energy Group reported a third-quarter adjusted loss of $0.41 per share while trailing 12-month earnings remained negative. If a Shadow Stock that is on earnings probation reports a subsequent quarterly loss, it is removed from the portfolio.
Sold: PC Connection (CNXN)
At the end of November, PC Connection exceeded the market-cap ceiling of $900 million with a market cap of $1.31 billion. It is the policy of the Model Shadow Stock Portfolio to sell a stock once its market cap reaches three times the initial purchase limit, which is now $300 million.
As of the end of November, 17 stocks met the initial selection criteria for the Model Shadow Stock Portfolio, up from 16 at the end of October. AAII members can see and research which companies are currently passing the initial selection criteria in the Shadow Stock Ideas table on AAII.com.
With the cash on hand and the proceeds from the two sells, there were enough funds to purchase three new stocks with a position size roughly equal to the average position size for the portfolio holdings: Bassett Furniture Industries (BSET), Cumulus Media Inc. (CMLS) and Perion Network Ltd. (PERI).
Purchased: Bassett Furniture Industries (BSET)
Bassett Furniture trades on the Nasdaq Global Market exchange and is a manufacturer, importer and retailer of home furnishings. Its range of furniture products and accessories are sold through a nationwide network of over 90 retail stores known as Bassett Home Furnishings.
Purchased: Cumulus Media Inc. (CMLS)
Cumulus Media is a leading audio-first media and entertainment company delivering content to over a quarter billion people every month. It offers local programming through 428 owned-and-operated stations across 87 markets. Cumulus Media is also a provider of country music and lifestyle content through its Nash brand, which is distributed through radio programming, Nash Country Weekly magazine, video and live events.
Purchased: Perion Network Ltd. (PERI)
Perion Network is an Israel-based global technology company that delivers data-driven online advertising and search solutions to brands and publishers. Its business solutions include Undertone, CodeFuel, MakeMeReach and Smilebox.
The next quarterly review of the AAII Model Shadow Stock Portfolio will take place at the end of February. In the meantime, you can follow the portfolio in the Shadow Stocks area on AAII.com. To receive monthly email updates along with alerts to any changes made to the portfolio, please sign up at www.aaii.com/email.
Shadow Stock Portfolio Rules
Stock purchases must meet these criteria:
Stocks are sold if any of the following occur:
AAII Model Portfolios

Investor Professor


Joe L from Pennsylvania posted over 6 years ago:
Steve from Alabama posted over 6 years ago:
Andy from CA posted over 6 years ago:
You need to log in as a registered AAII user before commenting.
Log InCreate an account