


Related

Portfolio Strategies
Our model portfolio is one of the oldest real-money examples of how the value and size premiums can be combined into a single strategy.

Factor investing has become a popular way to seek out excess returns.
At its best, factor investing is a systematic investment strategy supported by long-term empirical evidence that can be explained with economic and behavioral insight. The empirical evidence should be pervasive and expected to continue into the future. Common factors used today include value, momentum, size, quality, volatility and carry (yield).
Some investors focus on single factors to create their portfolios, like looking for the A students who excel in a specific subject. However, many investors seek to combine factors that are unrelated (negative or low correlations) but when combined contribute to more consistent performance, higher returns or lower risk.
Multi-factor approaches are akin to well-rounded students who achieve consistently high grades across a wide range of subjects, even if they don’t always get A grades.
The Model Shadow Stock Portfolio is one of the oldest real-money examples of constructing and managing a two-factor portfolio focused on value and size. The Model Shadow Stock Portfolio was started in January 1993 to show members how a consistent investment approach could be followed and to help them learn how to apply it in their own portfolios.
Table 1 shows the stocks that currently make up the portfolio.
The genesis for the creation of the Model Shadow Stock Portfolio was research from Eugene Fama and Kenneth French. Their oft-cited study, “The Cross-Section of Expected Stock Returns” (1992), found that company size, as measured by market capitalization, helped explain future market returns.
Market capitalization, or market cap, is simply calculated by multiplying the number of shares a company has issued by the share price. It is a common measure of company size and represents the market consensus of a company’s worth. Apple Inc.’s (AAPL) market cap is just above $1 trillion, while a number of smaller companies that trade on stock exchanges have a market cap of just a few million dollars.
The stocks with the lowest market cap outperformed the largest companies by a wide margin between July 1963 and December 1990. As shown in first column of Table 2, stocks in the lowest decile on average returned 19.1% a year versus 11.2% for the largest market-cap decile.
Table 1. Model Shadow Stock Portfolio

Notes
Approaching Size Limit: Stocks are sold if their market capitalization goes above three times the initial maximum criterion and there is a stock to replace it. The current market capitalization maximum for initial screening is $400 million. Stocks are marked “approaching size limit” if their current market cap exceeds 2½ times the initial criterion, or $1 billion.
Approaching Value Limit: Stocks are sold once their price-to-book-value ratio goes above three times the initial criterion and there is a stock to replace it. The current initial price-to-book ceiling is 1.00. Stocks are marked “approaching value limit” if their current price-to-book-value ratio exceeds 2½ times the initial criterion, or 2.50.
Earnings Probation: If last 12 months’ earnings are negative, the stock is put on probation; if a subsequent quarter has negative earnings prior to 12-month earnings becoming positive, the stock is sold. When available, adjusted (non-GAAP) earnings are used to put stocks on probation or sell them. Otherwise, earnings from continuing operations are used. The date is the fiscal quarter during which the company first reported negative trailing 12-month earnings.
Qualifies as of: Stock still qualified as a buy when the screen was run with current data. Stocks that don’t currently qualify as a buy are held until they meet one of the sell rules.
Researchers often rank domestic companies listed on the New York Stock Exchange (NYSE) by various factors to determine and record the different breakpoints that are then applied to stocks listed on other exchanges as well. This is done to maintain continuity over time when looking at market data before the growth of Nasdaq. Kenneth French maintains a useful data library on his Dartmouth College webpage (http://mba.tuck.dartmouth.edu/pages/faculty/ken.french/data_library.html).
Fama and French’s research also found that companies with the lowest price-to-book-value ratios (P/B) performed better than those with high measures. The price-to-book-value ratio is calculated by dividing share price by shareholder’s equity. The lowest price-to-book-value stocks, on average, returned 21.4% a year versus 8.0% for those with the highest price-to-book-value ratios as shown in the first row of Table 2.
Table 2. Returns of Stocks Grouped by Market-Cap Size and Price-to-Book Ratio
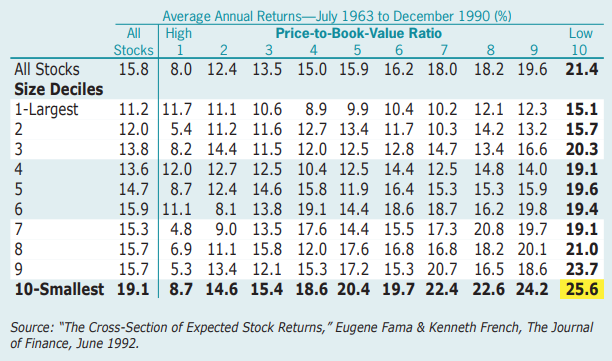
Taken individually, company size and valuation are factors investors can use to select stocks that, historically, have outperformed the broader market. However, they capture different elements or factors. What Fama and French discovered in their research is that, when combined, micro cap and low price to book value yield even better performance, as illustrated in Table 2.
An approach that combines the lowest decile by market cap and lowest decile by price to book value earned 25.6% per year on average versus 19.1% for the lowest market-cap decile, 21.4% for the lowest price to book value and 15.8% for the complete stock universe. The return of this combined portfolio is highlighted in the lower right-hand corner of Table 2.
The primary Model Shadow Stock Portfolio selection criteria target the value and size intersection, but the breakpoints that determine the NYSE deciles change over time. Table 3 provides a history of the size and value maximums used to manage the Model Shadow Stock Portfolio. The initial $55 million market-cap maximum for inclusion in the Model Shadow Stock Portfolio has grown to $400 million. The price-to-book-value ratio has fluctuated as well. It was lowest during 2001 and 2002, at 0.60, and is currently at its highest level of 1.00.
Table 3. Size and Value Maximums Used for the Model Shadow Stock Portfolio
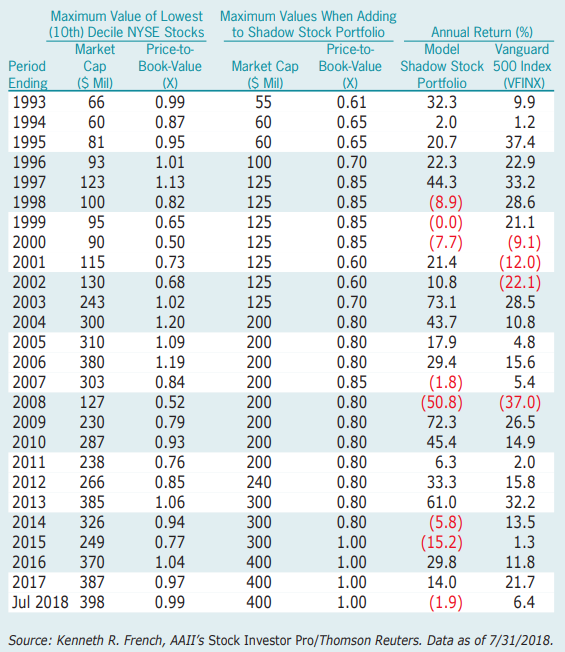
The high price-to-book valuation levels reflect the long and aging bull market. However, as noted in the May 2018 AAII Journal, successfully timing the market involves determining when to get out of the market as well as when to get back in. Missing the best market upturns often hurts long-term performance more than avoiding a portion of a bear market.
We will report on any quarterly portfolio actions for the Model Shadow Stock Portfolio in the October AAII Journal. You can follow the portfolio on AAII.com in the Model Portfolios area. To receive monthly email updates along with alerts to any changes made to the portfolio, please sign up at www.aaii.com/email.
Portfolio Strategies

Investor Professor

Portfolio Strategies

Thomas Eberhard from MN posted over 8 years ago:
Wayne Thorp from IL posted over 8 years ago:
Jim Nakos from NM posted over 8 years ago:
Steven Riggs from KY posted over 8 years ago:
Dave Gilmer from WA posted over 8 years ago:
James Critchley from MA posted over 8 years ago:
James Critchley from MA posted over 8 years ago:
You need to log in as a registered AAII user before commenting.
Log InCreate an account