


Related

Stock Strategies
AAII’s Value Grade for stocks incorporates six fundamental variables into a single value grade to help judge which stocks are potential bargains and which are expensive.
by Charles Rotblut | May 2020

Charles Rotblut leads a class in AAII's new Essential Investing Video Course. Go to https://www.aaii.com/ves for more information and to subscribe.
Value investors seek to buy stocks at a discount to their intrinsic value. Long-term returns show that such strategies are advantageous. Value stocks, as a group, tend to outperform growth stocks.
The two most popular measures of value are the price-to-book-value (P/B) ratio and the price-earnings (P/E) ratio. For both measures, low ratios are preferable to high ratios.
The price-to-book ratio compares a stock’s price to the book value per share. Book value is defined as assets minus liabilities. The concept of the price-to-book ratio is based on the notion of how much investors are paying to own a certain amount of assets.
The price-earnings ratio compares a stock’s price to its earnings per share. It is the multiple of earnings for the trailing 12 months that investors are paying. Higher price-earnings ratios signify greater expectations for future growth, whereas lower price-earnings ratios signify lower expectations for future growth or greater uncertainty regarding future earnings.
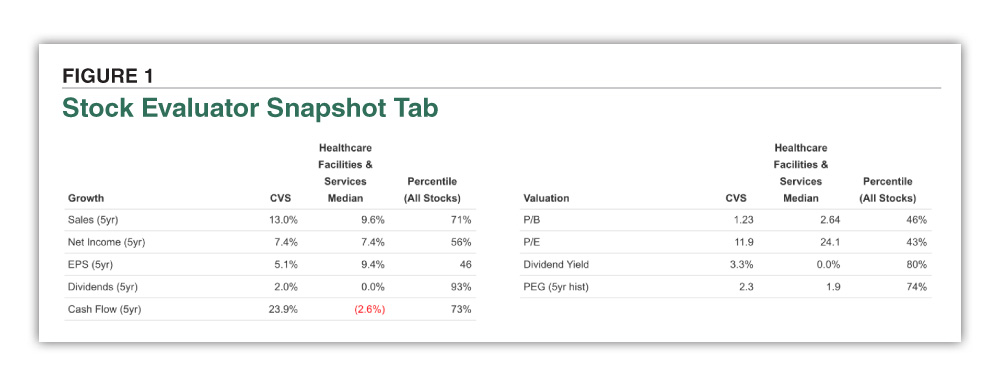
AAII members can find the price-to-book and price-earnings ratios for any stock by simply typing a company’s name and ticker symbol into the search bar located at the top of any page on AAII.com. Doing so will call up the stock’s snapshot page of our Stock Evaluator. On the right side of the page will be the current price-to-book and price-earnings ratios (see Figure 1).
Both ratios will fluctuate in response to market and economic conditions. Valuations were higher in early February 2020 than they were in mid-March 2020, for instance. These ratios will also be altered by first-quarter 2020 earnings reports. The loss of sales due to shelter-in-place orders issued in response to the coronavirus pandemic will reduce earnings for many companies, shrinking the “E” in the P/E ratio. The sharp spike in corporate borrowing will alter the shareholder equity that companies report, thereby changing the “B” in many stocks’ P/B ratio.
Because such changes can occur across a wide variety of companies, many investors prefer to look at a valuation ratio’s relative ranking instead of its absolute value. The absolute value is what you commonly think of when a price-to-book or price-earnings ratio is mentioned. It can be 1.5 for the price-to-book or 15.3 for the price-earnings ratio. The percentile rank is how a stock’s price-to-book or price-earnings ratio compares to all other companies. It tells you whether a stock’s valuation is comparatively high or low relative to other companies.
CVS Health Corp.  (CVS), shown in Figure 1, had a price-to-book ratio of 1.23 and a price-earnings ratio of 11.9 as of April 10, 2020. These ratios ranked in the 46th and 43rd percentiles of all stocks. Put another way, CVS Health traded with a cheaper-than-midpoint valuation based on these two ratios relative to all other stocks with valid ratios.
It is possible for a stock to appear cheap based on one valuation metric but appear expensive on another. It is also possible for one valuation ratio to be associated with outperforming stocks during certain periods of time but not others. Some stocks may even have null values for certain metrics like the price-earnings or the price-to-book ratio but not others. An example of this would be a company with losses instead of profits or a negative book value because of heavy borrowing. Negative earnings or book value result in non-meaningful ratios that are left blank or null.
A composite valuation helps to resolve such issues. It also provides a better idea of whether a given stock is truly cheap or expensive. James O’Shaughnessy is among those to utilize composite valuations. He advocated for such an approach in the October 2013 AAII Journal (“‘What Works’: Key New Findings on Stock Selection”).
We worked with O’Shaughnessy’s firm to create a valuation composite for our March 2014 AAII Journal article, “Finding Value and Financial Strength Based on ‘What Works on Wall Street.’” Recently, we expanded the composite from three variables to six. Those variables are the price-to-sales (P/S) ratio, price-earnings ratio, enterprise-value-to-EBITDA (EV/EBITDA) ratio, shareholder yield, price-to-book-value ratio and price-to-free-cash-flow ratio (P/FCF).
The price-to-sales ratio is the share price divided by sales (revenues) per share. Proponents of the price-to-sales ratio argue that earnings-based approaches to selecting stocks are inferior because earnings are influenced by many management assumptions trickling through the accounting books. The price-to-sales ratio can provide a meaningful valuation tool when negative earnings render earnings-based models useless. O’Shaughnessy’s research has found the price-to-sales ratio to work well both as a stand-alone factor and in conjunction with other ratios.
The enterprise-value-to-EBITDA ratio helps to measure the value of a stock relative to its earnings potential. Many investors feel that a company’s enterprise value relative to its earnings before interest, taxes, depreciation and amortization (EBITDA) is a better way to measure company value than the price-earnings ratio alone. The ratio is neutral to the company’s capital structure and capital expenditures.
A company’s enterprise value represents its economic value, which is the minimum value that would be paid to purchase the company outright. Enterprise value is equal to the market value of equity (including preferred stock), plus interest-bearing debt, minus cash. Enterprise value takes into account both the market price of equity and the debt used to generate earnings. Debt, which must be paid back, makes the true cost of acquiring such companies higher. EBITDA is an approximation of the firm’s operating cash flow.
A stock’s shareholder yield is the sum of its buyback yield and dividend yield. It shows what percentage of total cash the company is paying out to shareholders, either in the form of a cash dividend or as expended cash to repurchase its shares in the open market. Thus, if a company is paying a 5% dividend yield and has a buyback yield of 10%, its shareholder yield would be 15%.
A stock’s buyback yield is determined by comparing the average number of shares outstanding for a fiscal period with the average number of shares outstanding for another fiscal period.
Unlike other valuation measures, shareholder yield is inversely related to value, with higher shareholder yields implying lower valuations.
The price-to-free-cash-flow (P/FCF) ratio is calculated by dividing the share price by free cash flow per share for the most recent 12 months. Cash flow is reported on the cash flow statement. It is the sum of cash from operations, cash from investing and cash from financing adjusted for exchange rate effects. Free cash flow is calculated by subtracting capital expenditures and dividend payments from cash flow from operations.
While a company’s sales and earnings are useful measures, for a company to survive it must have the cash to finance its activities. Companies that generate sufficient cash can grow during periods of economic expansion, as well as cover expenses when sales decline during slowdowns.
The cash flow statement is also harder to manipulate through accounting techniques than earnings. Unlike earnings, which are an accounting figure, cash flow represents the net total of cash flowing into and out of the company over a given period.
We now incorporate all six variables into a single value grade to help judge which stocks are potential bargains and which are expensive. The Value Grade is assigned based on how each stock’s individual composite valuation compares to all other stocks. Grades are evenly distributed, so at any given time approximately the same number of stocks will be assigned a grade of A, B, C, D or F.
The process for assigning grades starts with each variable for a given stock. We calculate the percentile ranking for all valid ratios that a stock has. So, for instance, a stock could have a price-to-book ranking in the 43rd percentile, a price-earnings ranking in the 67th percentile, a price-to-sales ranking in the 23rd percentile, etc. We then average those rankings for each stock. (A minimum of two valid variables are required, though all six will be used if available.)
Once the average of the individual variables is calculated, we then rank that average against all stocks. Put another way, we rank how each stock’s composite valuation compares against all other stocks. These ranks are then sorted into quintiles from the cheapest 20% (a grade of A) to the most expensive 20% (a grade of F).
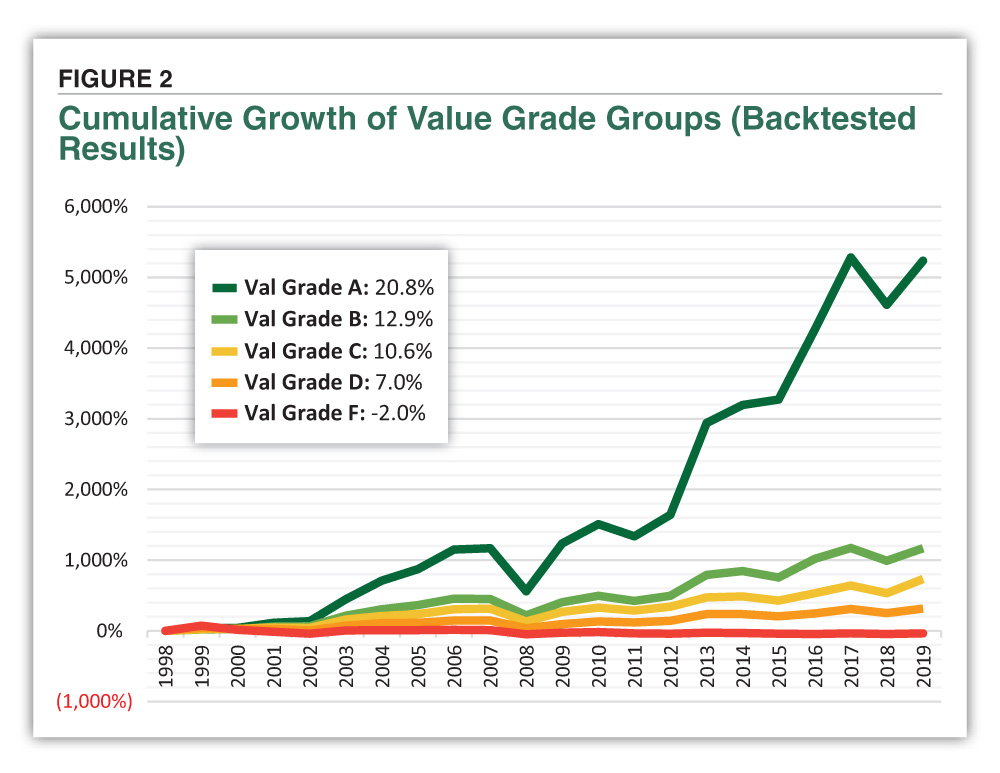
To ensure the validity of our revised methodology, we backtested all letter grades (A to F) for the period of 1998 through 2019. As we would expect, moving from Value Grades of F to D to C to B to A resulted in better cumulative returns for each higher grade. Even between Value Grades of A and B, the higher letter grade outperformed the lower by more than a factor of four, as shown in Figure 2.
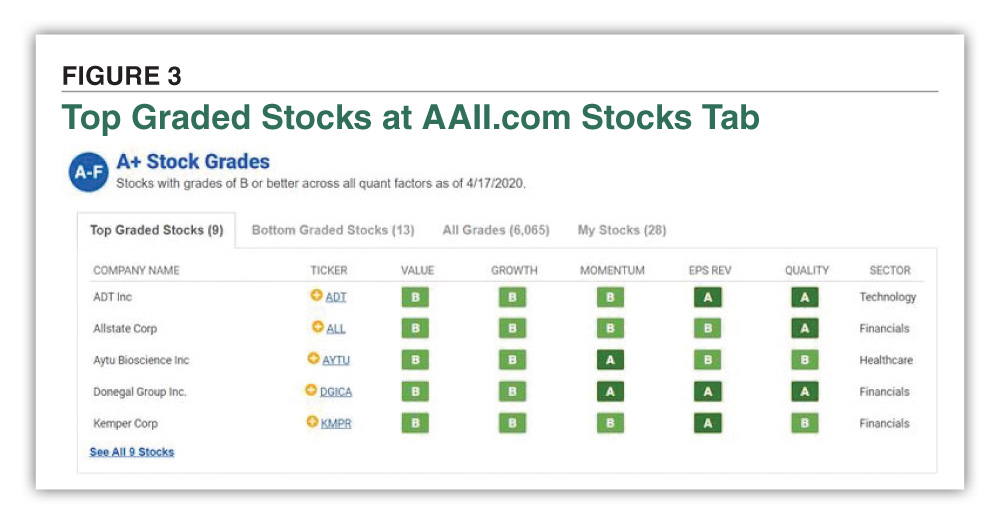
Value is one of the five Stock Grades included in our new A+ Investor service. AAII members can see of the top-graded stocks, those with Grades of A or B for value, growth, momentum, EPS revisions and quality on the A+ Stock Grades table, which is located on the Stocks page of AAII.com (Figure 3). A+ Investor subscribers have access to the expanded table.
A+ Investor subscribers can also use our Stock Grades Screener to identify stocks with certain grades.
Regardless of how you use value, remember this simple adage: high valuations = higher expectations = more room for disappointment.
Stock Strategies

Financial Statements

Value Investing

No comments have been added yet. Add your thoughts to the discussion!
You need to log in as a registered AAII user before commenting.
Log InCreate an account