


Derek Hageman leads a class in AAII's new Essential Investing Video Course. Go to https://www.aaii.com/ves for more information and to subscribe.

With credit markets squeezed and economic uncertainty rising, cash is once again king. Companies with solid cash positions provide a strong foundation during these turbulent times.
Before the coronavirus pandemic, the corporate landscape had been unusually cash-rich, with companies building up balances at a record pace, according to industry data. S&P Global Market Intelligence reported that, at the end of 2019, cash holdings among companies in the S&P 500 index (excluding financial, transportation, real estate and utility companies) approached record highs at $1.39 trillion, despite having spent record amounts on stock buybacks.
Companies that keep some dry powder on hand—and have historically been able to generate more—are often seen as high-quality firms. Many investors consider a company’s large cash position as the ultimate safety net.
Downturns are capitalism’s sorting mechanism, revealing weak business models and extended balance sheets. A potential cash crunch looms at companies as offices, factories and non-essential businesses are shut and quarantines are imposed.
To get a sense of the potential damage, The Economist conducted a crude “cash-crunch stress-test” of over 3,000 listed nonfinancial firms in major markets around the world. It assumes that their sales drop significantly and that they continue to pay expenses, such as wages and interest.
Within three months, 13% of firms exhausted their cash holdings. If the coronavirus pandemic continues to spread and the shutdown extends to six months, almost a quarter of the firms would run out of cash. With all of the fiscal and monetary stimulus, there is a reasonable expectation that the cash crunch will be temporary, but no one knows for sure. When activity resumes, cash can once again start flowing.
What It Takes: Cash Rich Firms Criteria
- Companies that are in the financial and utilities sectors and real estate operations industry are excluded;
- Earnings per share from continuing operations over the last 12 months and for the last fiscal year (Y1) are positive;
- Market capitalization for the last fiscal quarter (Q1) is greater than $50 million;
- Stock price is higher than $5 per share;
- Ratio of total liabilities to total assets for the last fiscal quarter (Q1) is less than the industry’s median ratio of total liabilities to total assets for the same period;
- Ratio of long-term debt to total capital for the last fiscal quarter (Q1) is less than the industry’s median ratio of long-term debt to total capital for the same period;
- Cash-to-price ratio is greater than 20%; that is, cash per share is at least 20% of the stock price per share; and
- Net-cash-to-price ratio is greater than 20%; that is, net cash (cash minus current liabilities) per share level is at least 20% of the stock price per share.
Investing in Cash-Rich Firms
 A healthy cash position provides important flexibility and safety to a firm. Cash-rich firms should be able to more easily meet their debt obligations, decreasing the probability of a creditor weakening the position of the equity investors or even gaining control of the firm. During an economic slowdown, cash allows a cyclical firm to continue its research and development efforts, as well as undertake capital expansion or productivity improvements, in anticipation of an economic rebound.
Firms with excess cash positions can also elect to distribute the cash to shareholders in the form of dividends. Many firms have also chosen to use excess cash to repurchase shares on the open market. This helps to boost the share price in the short term by providing demand for shares. And with fewer outstanding shares, the same level of net income boosts earnings per share.
Firms with excess cash can also attempt to use the cash strategically to broaden their product lines or diversify into new areas. This can be accomplished either through direct capital investment or the outright purchase of another firm.
A high cash position can also be a disadvantage. Cash is generally defined as cash plus marketable securities that are readily convertible into cash. This consists of bank deposits and short-term instruments such as Treasury bills. The cash position may reduce profitability if it earns a lower rate of return than other assets in the company. One would expect any corporate investment to earn more than the money market rate in the long run.
When finding firms with large cash balances, the critical question becomes: Why are they holding onto the cash? Often it points to a firm in a mature industry with few growth prospects. The firm may have reasonable profit margins, but little need for additional capital. For such a firm, the need for a good management team is especially important.
Performance
The Cash Rich Firms screen is built into AAII’s Stock Investor Pro fundamental stock screening and research database. The companies meeting the criteria of this strategy each month are used to calculate hypothetical performance.
Figure 1 shows that the Cash Rich Firms approach has outperformed the S&P 500 since the beginning of 1998. It has generated a compound annual price gain of 6.9% over the period from January 1998 through March 2020, while the S&P 500 is up only 4.5% annually over the same period.
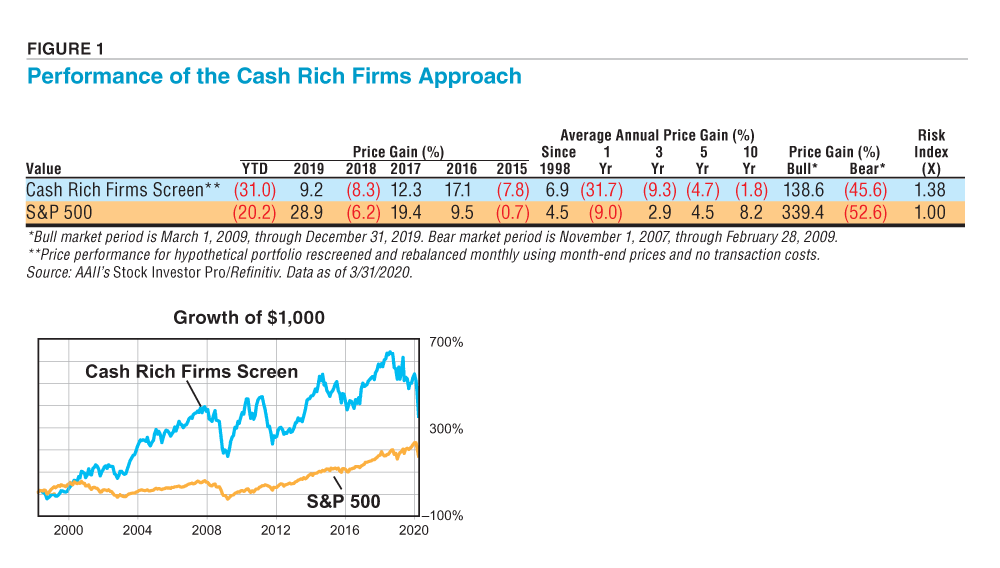
The strategy held up relatively well during the last full bear market (November 2007 through February 2009), down 45.6% versus a loss of 52.6% for the S&P 500. As a more defensive strategy, the Cash Rich Firms approach underperformed during the subsequent bull market (March 2009 through December 2019) gaining 138.6% compared to a cumulative price gain of 339.4% for the S&P 500.
The Cash Rich Firms strategy has underperformed year to date through March 31, 2020, down 31.0% versus a loss of 20.2% for the S&P 500. Volatility has increased over the past quarter and, if economic uncertainty continues, following the Cash Rich Firms approach may be a good method for defensive investors to find some opportunities.
You can follow the Cash Rich Firms strategy’s performance and see how it compares to the 59 other screening approaches that AAII tracks, at the Stocks area of AAII.com.
Measuring Cash Levels and Applying the Screen
Screening for firms with high proportions of cash to share price represents a reasonable strategy for tracking down cash-rich firms. Dividing cash by the number of outstanding shares provides us with the measure of cash per share. The amount of cash per share relative to the market price per share provides a useful indication of the cash level of the firm.
In addition to excluding financials, utilities and real estate investment trusts (REITs), a filter requiring positive earnings from continuing operations for the last 12 months is specified as a minimum current profitability requirement. This very simple screen helps to indicate that the passing firms are at least making some money in their ongoing operation. More stringent screens could look for positive free cash flow or positive cash flow from operations. Foreign companies and ADRs were not explicitly excluded.
The next criterion specifies a minimum share price requirement of $5. Without the minimum share price requirements, bankrupt firms with a share price of a few pennies could dominate the screen.
To measure the financial strength of the firm, we first screen for a debt-to-total-capital ratio below the industry norm. This is a popular measure of financial leverage. Debt for this ratio consists only of long-term debt, not total debt. Capital refers to all sources of long-term financing—long-term debt and stockholder’s equity. A high ratio indicates higher risk. However, a low level may not be an indication of low risk if current liabilities are high.
To help measure the overall levels of liabilities, we also require debt relative to total assets to be below the industry norm. The debt-to-total-assets ratio measures the percentage of assets financed by all forms of debt. A higher percentage, and a greater potential variability of earnings, translates into a greater potential for default. Yet, prudent use of debt can boost return on equity.
Our final conditioning screen looks for a minimum market capitalization (shares outstanding times price per share) of $50 million to help ensure a minimum level of trading liquidity.
Screening for High Gross and Net Cash
Our first screen for high levels of cash compares the cash per share to the stock price. We are looking for stocks with a cash level of at least 20% of the stock price. If you were to purchase a $10 stock with cash representing 20% of the stock price, one could argue that you are in effect paying only $8 for the business.
As important as it is to look at cash, it is equally important to look at the financial obligations of the firm. A high level of cash per share could be quickly reduced when considering the firm’s short-term liabilities and long-term debt. Some firms build up a cash reserve to ensure that they can meet the required payments of their short-term debt and current portion of long-term debt.
A useful modification to the ratio of gross cash to price per share is to subtract the short-term liabilities from cash to establish a net cash per share figure, which provides a better measure of the excess cash on hand. Dividing the net cash per share by the share price indicates how much of this “excess cash” is available on a per-share basis.
Our second screen for high levels of cash looks for stocks with a net cash per share level of at least 20% of the stock price. Normally, many of the firms with positive ratios of cash to price per share have negative ratios once short-term liabilities are considered.
Although holding large sums of cash can be a sign of strength, another important sign is a proven ability to generate more. We do not screen for this element in our analysis, but measures such as cash flow or free cash flow help to gain a feel for the cash generation. Free cash flow is calculated by taking the cash flow from operations as reported on the firm’s statement of cash flow and subtracting capital expenditures and dividends. This measure attempts to capture whether the firm is generating enough cash to help fund any necessary internal capital expenditures.
Profile of Passing Companies
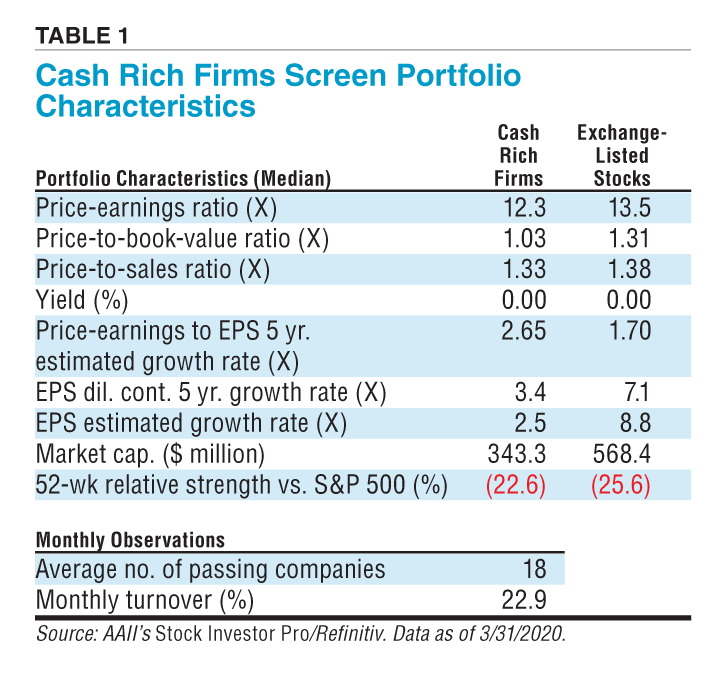
Table 1 highlights the characteristics of stocks meeting the Cash Rich Firms screening criteria as of the end of March.
Many of AAII’s screening approaches search for stocks that are attractively priced relative to some measure of intrinsic worth. Of course, determining the intrinsic value is the heart of fundamental valuation. These screens usually incorporate traditional valuation metrics such as the price-earnings ratio or the price-to-book ratio as primary screening criteria.
The Cash Rich Firms screen does not have an explicit valuation metric as part of its screening filter. For the stocks currently matching the approach, the median value of the price-earnings ratio of 12.3 is below the 13.5 median value of all exchange-listed stocks. The median values of the price-to-book ratio and price-to-sales ratio are also below the median values of these metrics for all exchange-listed stocks.
Passing Companies
Fifteen companies met the Cash Rich Firms criteria as of March 31, 2020. They are listed in Table 2 and ranked by net-cash-to-price ratio in descending order. The current number of passing companies is slightly below the historical monthly average of 18.
Go to All Screens for an updated list of stocks passing this screen.
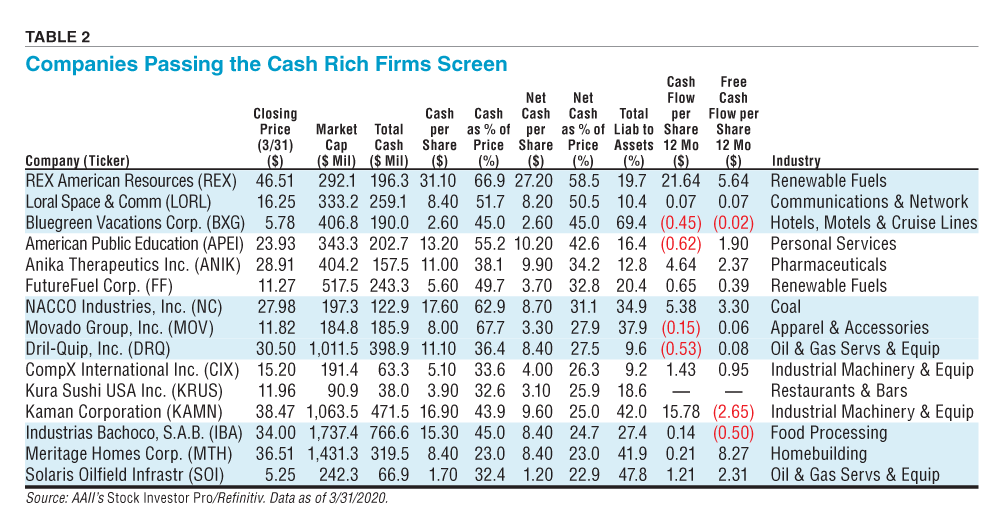
To meet the criteria and qualify as one of the Cash Rich Firms, a company’s cash-to-price ratio and net-cash-to-price ratio must be greater than 20%. REX American Resources Corp.  (REX), an operator in the renewable fuels industry with investments in ethanol fuel production entities, looks strong on these metrics, as its cash-to-price ratio is 66.9% and its net-cash-to-price ratio is 58.5%.
In the case of Movado Group Inc. (MOV), a watch designer and marketer, considering short-term liabilities drops the ratio from 67.7% for gross cash to price to 27.9% for net cash to price.
Beyond looking at the static cash positions of these firms, an examination of the actual cash generated by the firm is even more important for a long-term investor. As mentioned above, we do not screen for this element in our analysis, but measures such as cash flow or free cash flow help to gain a feel for the cash generation. Anika Therapeutics Inc. (ANIK) is a pharmaceutical company focused on developing, manufacturing and commercializing orthopedic medicines. The company’s cash flow of $4.64 per share and free cash flow of $2.37 per share indicate its ability to generate more cash.
In Table 2, Bluegreen Vacations Corp. (BXG), a company in the vacation ownership industry, has a positive net-cash-to-price ratio, but has a negative free cash flow per share. It is not generating enough cash from its operations to cover its current capital expenditures.
Belief in Management Is Critical
Screening for cash-rich stocks is not a simple process. Preliminary filters should screen for companies that not only have a high level of cash per share, but also a strong balance sheet, the potential for future earnings growth and positive free cash flow per share. A high net cash level relative to share price does not ensure financial strength or price stability. In selecting final candidates, much of the analysis rests on your belief in management’s ability to use and invest any cash holdings wisely.
As always, keep in mind that screening is only the first step in the investment process. The stocks passing this, or any other screen, do not represent a “recommended” or “buy” list. Before making any investment decisions, it is important to perform adequate due diligence to identify those stocks that match your investing tolerances and constraints. ?

Related

AAII Stock Ideas
Strategic Value Investing: Screening for Cash Flow and Value
Related

Financial Statements
The Cash Flow Statement: Tracing the Sources and Uses of Cash
Discussion
FREE REPORT

Get your free copy of our special
report analyzing the tech stocks
most likely to outperform the
market.
Robert McLaughlin from Virginia posted over 6 years ago:
You need to log in as a registered AAII user before commenting.
Log InCreate an account