Most academic research suggests that investing in glamour growth stocks is a losing proposition. However, as with value investing, some growth stocks deserve their high valuations while many do not. Partha Mohanram, who holds the John H. Watson chair in value investing at Rotman School of Management, University of Toronto, developed a scoring system to help separate the winners from the losers among stocks trading with high price-to-book-value ratios. The grading system looks at company profitability and cash flow performance, adjusts for likely mistakes due to naïve growth projections and considers the impact of conservative accounting policies to form a growth score, or G-score.
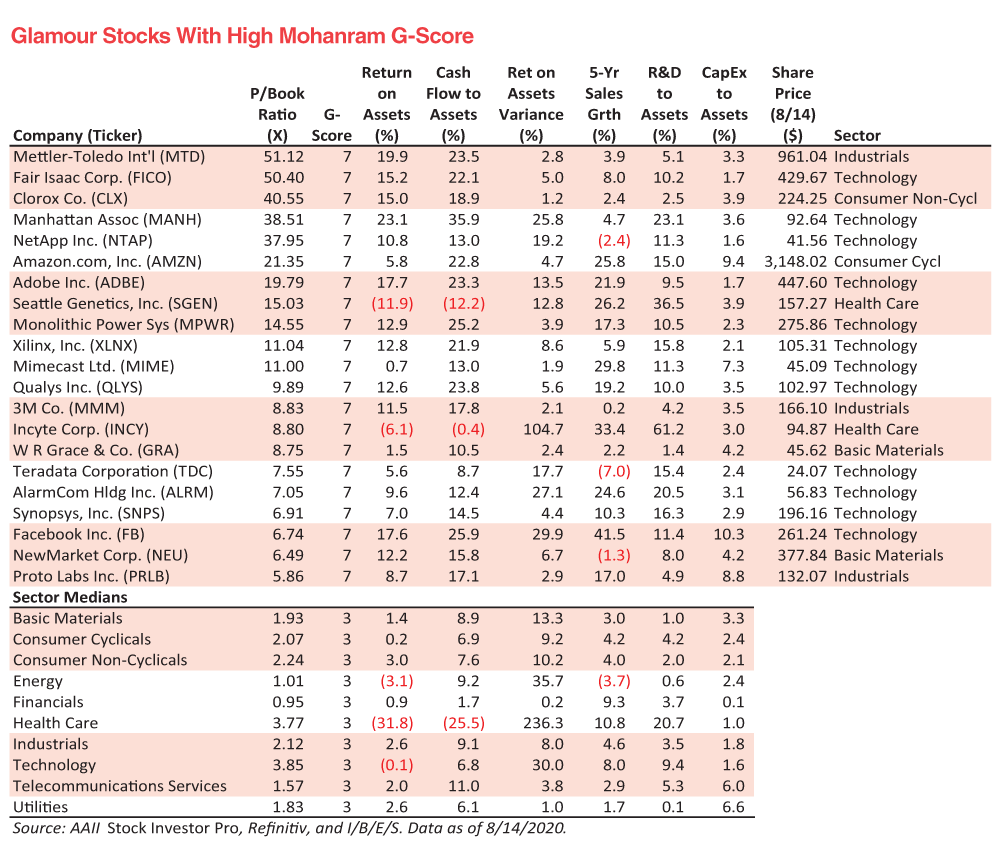
For the First Cut, we started with a universe of exchanged-listed high-price-to-book-value stocks. Mohanram warns investors that these stocks do not perform well as a group, but it is possible to use fundamental analysis to help avoid the biggest losers and select the strongest candidates. Mohanram developed an eight-point score, but the data source AAII uses does not break out advertising expenditures. Therefore, the First Cut had a maximum G-score of seven. Mohanram awarded up to three points for profitability—one for return on assets above the industry median, one for a ratio of cash flow from operations to assets above the industry median and one point if the cash flow from operations exceeds net income. In grading growth, points were awarded for greater stability in return on assets and year-to-year sales growth compared to sector medians. Mohanram identified spending on research and development (R&D), capital expenditures (capex) and advertising as factors that may point to future sales and earnings expansion. The final two growth points were awarded for companies that spend more on R&D and capex as a percentage of assets compared to sector medians. Stocks with a price-to-book ratio within the top 20% of all companies, while possessing a G-score of seven made the First Cut. The table is ranked by price to book, with the most expensive stocks listed first. The individual components of the G-score represent a useful checklist for investors examining growth stocks. ▪







GEORGE V from NC posted over 6 years ago:
You need to log in as a registered AAII user before commenting.
Log InCreate an account