


Related

AAII Model Portfolios
An enlightening look at the price-to-book relationship between large- and small-company stocks over time.
by John Bajkowski | May 2020

While we understand that the superior long-term returns of small-cap value stocks have been accompanied by greater short-term volatility and extended periods of underperformance, it does not make living through a downturn any less painful.
Smaller companies tend to be weaker financially than larger companies, often exhibiting slimmer profit margins with less access to financial resources during times of distress. Many of the largest companies have a stronger virtual presence, helping them in the current environment. Shares of Amazon.com Inc. (AMZN) are actually up nearly 30% for the year through mid-April. Small-company stocks tend to be more domestically focused, while large-company stocks tend to be more globally oriented. The companies that make up the S&P 500 index obtain around 40% of their revenue outside the U.S. These characteristics make small companies more sensitive to interest rates and domestic economic cycles. Lower trading liquidity of smaller companies tends to magnify the magnitude of the movement of their stock prices.
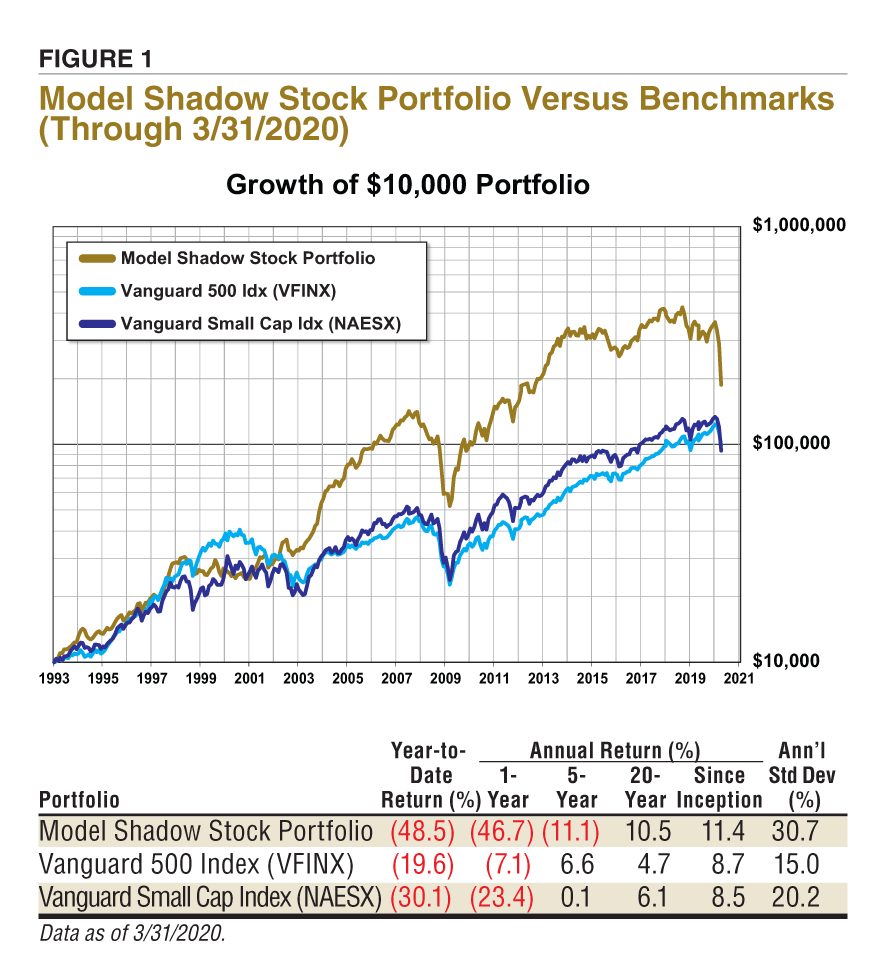
The Model Shadow Stock Portfolio lost 35.1% during March, bringing its year-to-date loss (through March 31) down to 48.5%, as shown in Figure 1. In contrast, the S&P 500 as measured through the Vanguard 500 Index fund (VFINX) was down 12.4% in March and is down 19.6% year to date, while the Vanguard Small Cap Index fund (NAESX) lost 21.9% in March and is down 30.1% year to date through March. The DFA U.S. Micro Cap fund (DFSCX) was down 23.3% during March and is down 34.7% during the first quarter of the year.
Since its inception in 1993, the AAII Model Shadow Stock Portfolio has a compound annual average return of 11.4% versus the Vanguard 500 Index fund’s gain of 8.7% per year on average over the same period. Over the same period, the Vanguard Small Cap Index fund posted an average annual gain of 8.5%.
Market capitalization, or market cap, is simply calculated by multiplying the number of shares a company has issued by the share price. It is a common measure of company size and represents the market consensus of a company’s worth.
In the large-cap segment, value stocks were down 15.3% for the month, bringing their year-to-date performance to a loss of 25.3% for 2020. Large-cap growth stocks were down 10.0% during March and lost 14.5% year to date.
Mid-cap value stocks are down 35.1% for the year, after losing 24.2% during March. Mid-cap growth stocks are down 24.7% for the year, after losing 16.8% during the month.
Small-cap value stocks are down 35.7% year to date, while small-cap growth stocks are down 25.8% for the year. Small-cap value stocks gave up 24.7% during March, while small-cap growth stocks lost 19.1% during the month.
While all sectors are showing losses for the year through the end of March, stocks in the information technology (–11.9%), health care (–12.7%) and utilities (–13.5%) sectors have the smallest losses this year. Sectors that are down the most this year include energy (–50.5%), financials (–32.0%) and industrials (–27.1%).
In a complete reversal from the previous decade, large-cap growth stocks outperformed small-cap value stocks during the decade of the 2010s, a pattern that has continued this year.
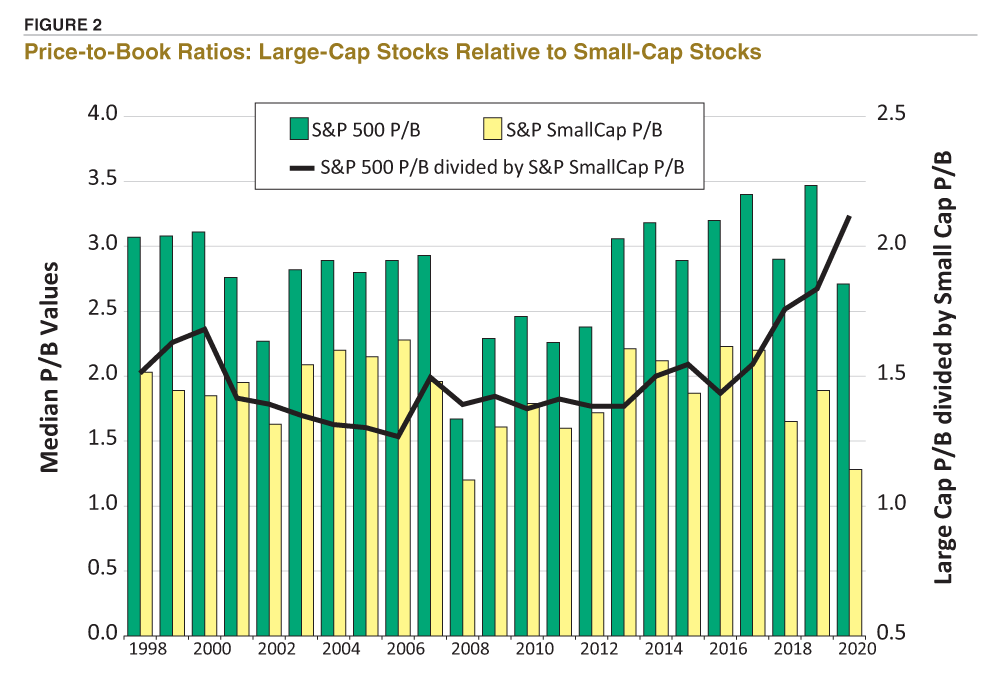
One begins to wonder how the relative valuations of small companies currently compare to those of larger firms. As of April 17, 2020, the median price-to-book value of the stocks in the S&P 500 was 2.71, while the median for the stocks in the S&P SmallCap 600 index was 1.28. Currently the stocks in the S&P 500 are trading with a price-to-book-value ratio more than double those of small-cap stocks.
 The price-to-book-value ratio is calculated by dividing the share price by book value per share. Book value is generally determined by subtracting total liabilities from total assets and then dividing by the number of shares outstanding. It represents the value of the shareholder’s equity based upon historical accounting decisions. The price-to-book ratio was a favorite measure of Benjamin Graham and is the core valuation measure used for the Model Shadow Stock Portfolio. Fama and French’s “The Cross-Section of Expected Stock Returns,” published in the June 1992 Journal of Finance, is among the most cited research on the performance of the price-to-book ratio in modern times. The study documented significantly higher returns for portfolios of low price-to-book ratio stocks compared to portfolios of high price-to-book ratio stocks.
We thought it might be enlightening to see the price-to-book relationship between large- and small-company stocks over time. Using AAII’s Stock Investor Pro stock screening analysis program, we were able to perform the analysis going back to 1998. We used median values, which is the midpoint of the range of values, rather than averages for our analysis of the price-to-book values over time. Averages can be skewed by a small number of extremely large or small values.
Figure 2 displays the year-end price-to-book median values for the companies within the S&P 500 and the S&P SmallCap 600. The large-cap values are represented by the green bar, while small-cap values are displayed by the gold bar. The axis on the left side of the chart lists the price-to-book values. The 2020 bar captures the price-to-book ratios as of April 17, 2020. The year-end median of the S&P 500 stocks has an average of 2.81 over the last 22 years. The highest value of 3.47 was registered at the end of 2019, while the lowest year-end value of 1.67 for the S&P 500 stocks was observed at the end of 2008. Stocks within the S&P SmallCap 600 have an average year-end price-to-book ratio of 1.91, with the highest value of 2.28 at the end of 2006 and lowest value of 1.20 at the end of 2008 during the financial crisis.
Dividing the price-to-book ratio of the S&P 500 stocks by that of the constituents of the S&P SmallCap 600 provides a helpful ratio that reveals the relative relationship over time. The ratio is captured on Figure 2 as the black line with the values for the ratio on the right side of the chart. When the black line goes higher, large-cap stocks are relatively more expensive than small-cap stocks. Small-cap stock valuations were the highest on a relative basis in the mid-2000s. In contrast, the divergence in the price performance for large versus small companies is dramatically captured over the last few years. Large-cap stocks have grown more expensive, while small-cap stocks have become relatively cheaper. The current ratio stands at 2.12 (2.71 divided by 1.28), well above the 1.47 average observed over the last 22 years. The chart should give investors in small-company stocks something to cheer about, as small-cap price-to-book valuations currently look more attractive.
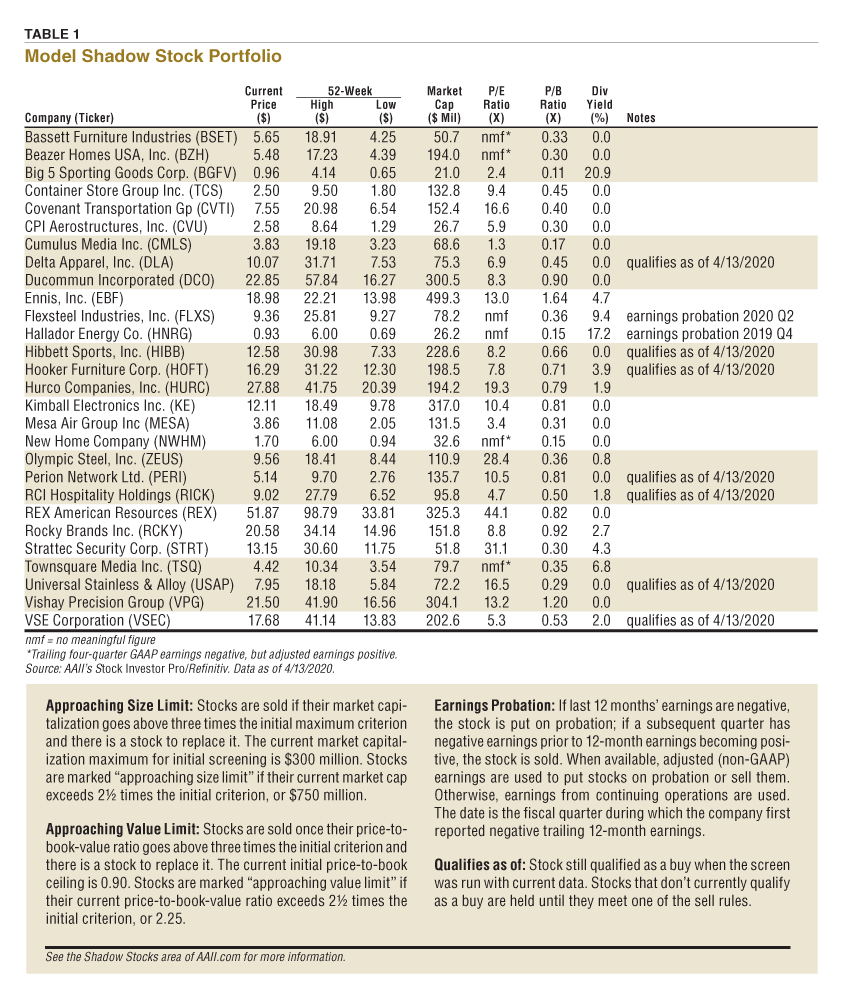
Table 1 shows the current holdings in the Model Shadow Stock Portfolio. After conducting the quarterly review of the Model Shadow Stock Portfolio in April, no stocks were removed or added to the portfolio. Flexsteel Industries Inc.  (FLXS) and Hallador Energy Co. (HNRG) were put on earnings probation as their trailing four-quarter earnings from normal operations turned negative. They will be removed from the portfolio if they report negative quarterly earnings again prior to the trailing four-quarter earnings turning positive. With the sudden decline in economic activity, one would anticipate greater portfolio turnover from negative earnings over the course of the year.
 If you are looking for stock ideas to invest excess funds, the list of Shadow Stocks that currently qualify represent a good starting point. As of April 13, 2020, 39 stocks met the initial selection criteria for the Model Shadow Stock Portfolio. The list of passing companies is published in the Shadow Stocks section of the AAII website on a page labeled Shadow Stock Ideas. Seven of the 39 passing companies are currently held in the Model Shadow Stock Portfolio—Delta Apparel Inc. (DLA), Hibbett Sports Inc. (HIBB), Hooker Furniture Corp. (HOFT), Perion Network Ltd. (PERI), RCI Hospitality Holdings Inc. (RICK), Universal Stainless & Alloy Products (USAP) and VSE Corp. (VSEC). They are designated as “qualified as of 4/13/2020” in the notes column of the Model Shadow Stock Portfolio table. Note that on our website, the qualified label for the actual Model Shadow Stock table is revised daily and dynamically updated.
Stocks are sold during the quarterly review if their market capitalization goes above three times the initial maximum criterion of $300 million and there is suitable stock available for purchase. With the strong market sell-off, no current holdings are approaching the size ceiling. Ennis Inc. (EBF) has the greatest current market level of $499.3 million as of April 13, 2020.
The price-to-book ratio is also examined during the quarterly review; any companies that exceed three times the initial price-to-book limit of 0.90 are sold. Ennis is trading with the highest price-to-book ratio of 1.64, well below the maximum ceiling of 2.70.
The next quarterly review of the AAII Model Shadow Stock Portfolio will take place around the end of May 2020, after most of the Shadow Stock holdings have announced their quarterly earnings. Any changes to the portfolio will be announced at the time they are made in a special Model Shadow Stock Portfolio Update email (sign up at www.aaii.com/email). ▪
AAII Model Portfolios

Small Cap Value Investing

Stock Strategies

Joe L from PA posted over 6 years ago:
Hugh from WA posted over 6 years ago:
d from Fl posted over 6 years ago:
Steve from IN posted over 6 years ago:
Jean from AAII posted over 6 years ago:
ANDREW B from CA posted over 6 years ago:
MICHAEL S from WV posted over 5 years ago:
You need to log in as a registered AAII user before commenting.
Log InCreate an account