

Related

Value Investing
If you apply the lessons of the past 90 years, it’s reasonable to expect favorable returns from following simple strategies that combine a few key asset classes.

Paul Merriman leads a class in AAII's new Essential Investing Video Course. Go to https://www.aaii.com/ves for more information and to subscribe.
It’s easy (and quite common) for investors to believe they need complex portfolios to maximize their long-term returns. After all, investment products are available in a dizzying array of varieties and combinations; furthermore, there’s reliable data on multiple types of investments.
I’m not entirely immune myself. I have spent hundreds—maybe even thousands—of hours studying, discussing, presenting and writing about what I call the Ultimate Buy and Hold Strategy, which consists of 10 equity asset classes. This combination has produced very favorable long-term results, and it makes up the bulk of my own equity investments.
But here I want to present a much simpler investment plan that has produced similarly good results over the decades.
I think of this as the Four-Fund Combo Portfolio. It’s made up of index funds equally weighted in four U.S. equity asset classes: large-cap blend stocks (represented by the S&P 500 index), large-cap value stocks, small-cap blend stocks and small-cap value stocks.
Large-cap blend stocks represent the cream of the crop of U.S.-based companies. (The term “blend” indicates a mixture of growth companies and value companies.) Many are household names and, in many cases, they are blessed with solid financials, good management, dominant positions in their industries and overall reputations for being excellent.
These companies are ones you could “bring home to mom” to brag about.
Large-cap value stocks represent companies that also may have familiar names and long histories. For a variety of reasons, however, their stocks are viewed less favorably by Wall Street. (Lake Wobegon aside, not all stocks can be above average.)
Why own companies like these? Because relative to their current earning power, you can get them at bargain prices—something you don’t find so often among large-cap growth stocks.
Small-cap blend stocks represent small companies with lots of room to grow bigger. Over the decades, small-cap companies, when owned by the hundreds, have often outperformed larger companies because of that growth potential.
Small-cap value stocks combine the attributes of small companies and those that are out of favor at the same time: room to grow, at bargain prices.
 That’s all an oversimplification, of course. But if you put these four types of stocks together in equal measure, you have a surprisingly robust, wide footprint of the U.S. stock market. Last spring when the stock market suddenly blew up, I argued that this combination would make an excellent “comeback portfolio.”
What I’m writing about here is not a cure-all for troubles. When the markets implode, there’s no thoroughly safe hiding place. But if you want to put history on your side, you can do it without any complicated assets or alternative investments. No hocus-pocus or get-rich-quick claims. You can start with just four low-cost index funds.
Simplicity itself.
The S&P 500 (large-cap blend) is the most common proxy for the U.S. stock market. Lots of people think you could start and end your portfolio right there—and for some investors that may be enough.
But twice in just the past 20 years, the S&P 500 has dealt out losses of over 50%: the technology tumble of 2000–2002 and the real estate collapse of 2007–2008. For true peace of mind, you should have something more.
Still, this broad market index has compounded at nearly 10% since 1928—through world wars (hot and cold), depressions, recessions and all manner of crises. (That 10% figure and all other compound returns cited here are nominal; they do not account for the effects of investment costs, taxes and inflation.)
The S&P 500 is a good workhorse, so to speak, and it makes up 25% of the comeback portfolio.
The S&P 500 is a solid start. But as we’ll see, the other three asset classes that I’m prescribing have outperformed the S&P 500 over the past nine decades.
Value stocks (both large-cap and small-cap) have a strong track record of outperforming growth stocks over the long haul, though not in every single year or even every decade.
The second half of the Four-Fund Combo Portfolio mirrors the first, but only concentrates on small-cap stocks.
With equal weightings in those four asset classes, you will be set up to capture a piece of the action, whether the market leaders are small-cap stocks or large-cap ones, and whether growth stocks or value stocks are outperforming at any given time.
These four funds will keep your assets in U.S. stocks, which many people find more comfortable than international stocks. That matters, because the more comfortable you are with your portfolio, the more likely you’ll stick with it—and reap its long-term rewards.
(Of course, the same thing could be said about a poorly chosen portfolio that’s comfortable. So, it’s important to understand the reasons behind your choices.)
Reliable data going back to 1928 gives us some numbers to support my argument for diversifying beyond the S&P 500.
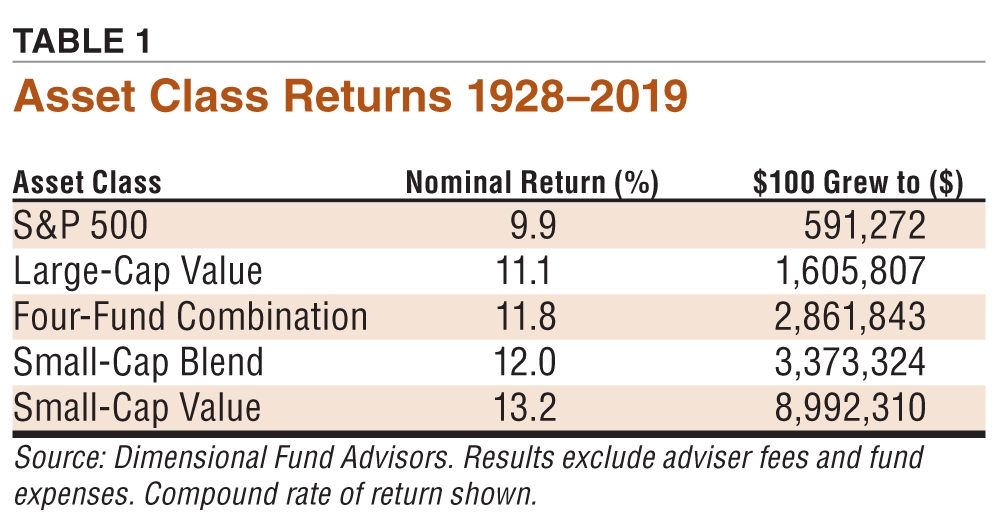
The S&P 500 had a compound return of 9.9% over the 92 years from 1928 through 2019. In that same period, large-cap value stocks compounded at 11.1%, small-cap blend stocks at 12.0% and small-cap value stocks at 13.2%. When you put these four asset classes together in equal measures with annual rebalancing, the return was 11.8%.
That is pretty strong evidence that this simple combination can provide—and actually did provide—superior returns for very long-term investors.
At first glance, the numerical differences in annualized returns—from 9.9% to 13.2%—may not seem overwhelming. But over very long periods, they are huge, as you can see in the right-hand column of Table 1.
Although 92 years is far beyond a typical investment horizon, it’s interesting to note that over the decades, the four-fund combination produced 4.8 times as many dollars as the S&P 500.
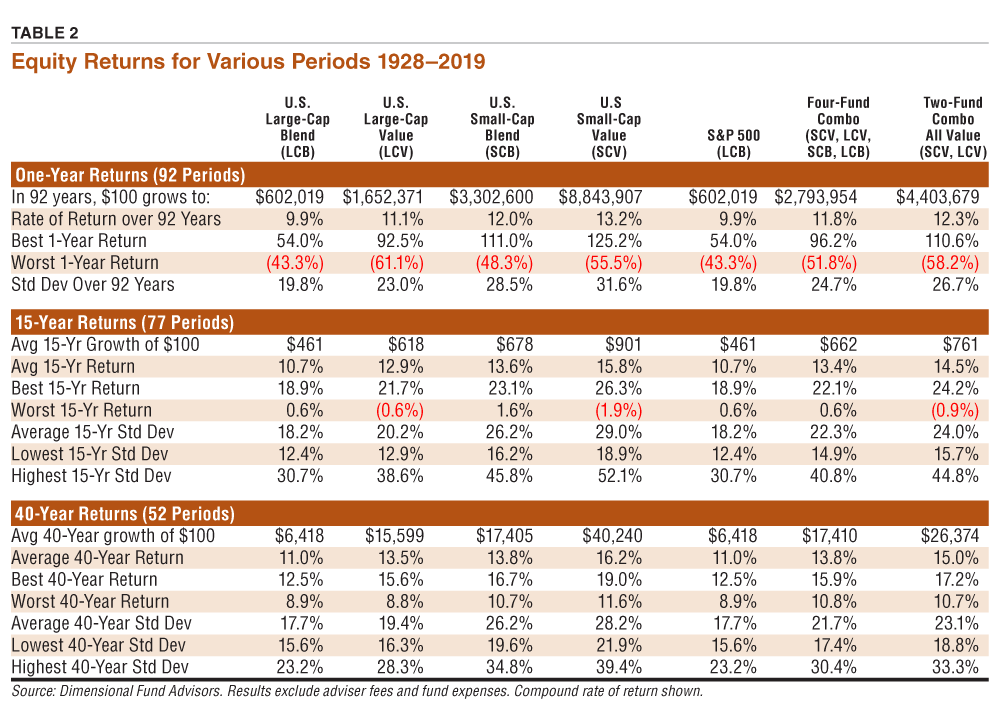
The data back to 1928 contains some more interesting lessons for those who dig a bit deeper. You’ll find these numbers and more details in Table 2.
Looking at the best and worst returns of the Four-Fund Combo for the last 92 one-year time periods, you see that they span quite a range: From a loss of 51.8% in one year to a gain of 96.2% in another.
But over 15-year periods, the four-fund combination never had a cumulative loss. And over 40-year holding periods, the worst compound rate of return for this combination was 10.8%, essentially the same as the average 40-year return of the S&P 500 (11.0%).
The far-right column in Table 2 shows comparable results for a two-fund “all-value” variation of this combination. This may be attractive to investors willing to take on a somewhat higher level of risk in order to seek higher returns.
If you compare the last two columns, you will see that all value delivered higher returns and higher risks (standard deviation) across the board when compared with the four-fund combination.
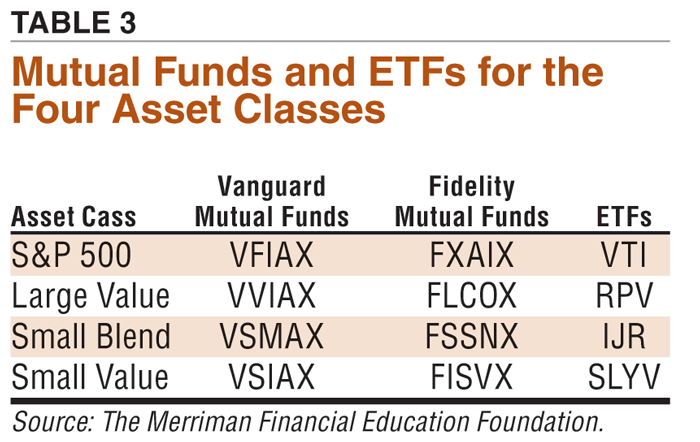
It’s easy to put the Four-Fund Combo Portfolio together. Table 3 shows the tickers for sample index funds and no-commission ETFs available at Vanguard and Fidelity.
The following discussion focuses on the nine decades from 1930 through 2019. The period—starting with 1930 instead of 1928—is slightly different, as are the numbers. But the lessons are the same.
Let’s start with a decade-by-decade comparison of the S&P 500 versus the four-fund combination.
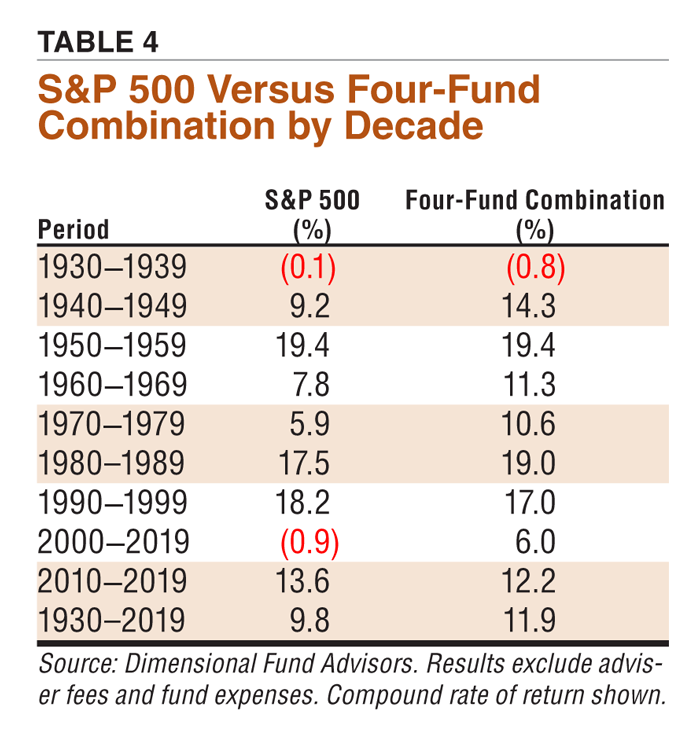
Setting aside the 1930s, the four-fund combination had a positive return in every decade—and with only one exception those gains were in double digits. The S&P 500 had only one losing decade, with double-digit gains in four, as seen in Table 4.
In five of the eight post-1940 decades, the combination outperformed the S&P 500, as it did over the entire 90-year period.
We’re now in the dig-into-the-details part of this article, so let’s compare the asset classes we have discussed plus returns of long-term government bonds and one-month Treasury bills. Calendar decades were used for this analysis to compare the returns of the four categories of stocks, the two categories of stocks and the four-fund combination.
The four-fund combination was never in first place during any single decade, although it managed to capture second in three of the nine decades. With that said, investors nearly always did better than average with the four-fund combination. And (with the glaring exception of the 1930s), they nearly always did well with small-cap value stocks. Even when small-cap value was below average in the period of 2010–2019, it returned 11.0%.
Something else that jumps out at me when I look at the data: U.S. small-cap value stocks were in first place in five of these nine decades―as well as for the entire period.
 It’s obvious that when you look one decade at a time, there was no way to predict which asset classes would excel and which would lag.
Even more difficult, by far, is trying to predict the markets one year at a time, as you can see in so-called “periodic tables of investment returns,” such as one published by the Callan Institute (www.callan.com/wp-content/uploads/2020/01/Classic-Periodic-Table.pdf).
I call this to your attention in order to show just how variable the results can be from one year to the next. Yes, trends exist. But if you think one year’s results are predictable based on the previous year’s returns, this table should set you straight.
Longer-term returns are much more reliable―and it turns out also more consistent―than shorter-term ones. Our nine decades of data give us the opportunity to look at asset class returns 20 years at a time.
Specifically, we looked at four distinct periods: 1940–1959, 1960–1979, 1980–1999 and 2000–2019. In every case, performance of the four-fund combination was above average and higher than that of the S&P 500. In every case, small-cap value stocks ranked either #1 or #2. (And perhaps encouraging to investors of all persuasions, every single return was positive.)
Most investors, whether they realize it or not, can look forward to 30 or more years of investment results. (This includes many people, perhaps the majority, who retire at age 65.)
Having nine decades of results allowed us to analyze the data in three distinct 30-year periods. When I look at the returns from this perspective, I see four clear patterns that confirm what the academics say should be expected over long periods:
In addition, as we also saw when we looked at returns two decades at a time, the four-fund combination was rock-solid in the rankings as a way investors could have achieved double-digit long-term returns without having to guess or predict which of these major U.S. asset classes would excel and which would lag.
I think these 30-year periods contain four other very important lessons for long-term investors:
At the outset I said many investors seem to think they need complex portfolios to get good long-term returns. But more than 90 years of data tells us that just isn’t so.
My rules for equity investing are simple and based on the past.
If 90 years of history is any guide, it reflects the comparative returns of various assets classes going forward. If you apply its lessons, it’s reasonable to expect favorable returns from following strategies such as the Four-Fund Combo Portfolio. ▪
Value Investing

Portfolio Strategies


TONY H from MD posted over 6 years ago:
BRUCE B from MA posted over 6 years ago:
BRYAN Z from WA posted over 6 years ago:
WILLIAM B from PA posted over 6 years ago:
MICHAEL M from VA posted over 6 years ago:
WILLIAM H from CA posted over 6 years ago:
ROBERT M from MI posted over 6 years ago:
ROBERT F from PA posted over 6 years ago:
SUDHIR M from IL posted over 6 years ago:
SCOTT W from PA posted over 6 years ago:
JEAN H from IL posted over 6 years ago:
W S from CA posted over 6 years ago:
P from FL posted over 6 years ago:
THOMAS P from TX posted over 5 years ago:
ALEX F from CA posted over 5 years ago:
BEDFORD J from TN posted over 5 years ago:
Jim M from OR posted over 4 years ago:
CRAIG B from WI posted over 3 years ago:
D. R from MD posted about 1 year ago:
You need to log in as a registered AAII user before commenting.
Log InCreate an account