



Related

AAII Model Portfolios
Although the S&P 500 index should be regarded as the base of an equity portfolio, small-cap value is a more profitable asset class over the long term.

Paul Merriman leads a class in AAII's new Essential Investing Video Course. Go to https://www.aaii.com/ves for more information and to subscribe.
Most investors understand the basics of diversification, which is one of the most important ways to take care of your portfolio. But my experience of talking to thousands of investors for over more than half a century tells me that many people could benefit from taking a deeper cut.
At its core, diversification is essentially a matter of defense.
The industry likes to focus on offense, getting customers to imagine all the wonderful gains they will achieve. And many investors are easily swayed to this kind of thinking. But seasoned investors who have been through the rough times know that hanging on to what you have can be just as important as trying to get more.
 Once you’ve accepted the risks of owning equities and figured out how much of your portfolio they should make up, the most important thing you can do is think about diversification. And the most important diversification decision may be one that gets far too little attention from investors: weight.
No, I’m not talking about dieting, though that’s always a worthy idea. I’m talking about the makeup of what goes into mutual funds and individuals’ portfolios.
The very important distinction here is the difference between capitalization weighting and equal weighting. In some cases, it makes a big difference in performance.
Think about the S&P 500 index or the fairly similar total U.S. market indexes. (For purposes of the following discussion, most international stock indexes are similar.) These indexes are cap-weighted, reflecting the overall nature of the U.S. capitalist economy. If you are contributing to a 401(k) or similar retirement plan, chances are high that the equity part of your portfolio is made up of funds like this.
Cap weighting means that the giant companies in the index have by far the most influence in its makeup. That means Microsoft Corp. (MSFT), the most valuable component of the S&P 500 at $1.07 trillion (total shares outstanding times stock price) accounts for about 4.3% of the weight of the S&P 500. On the other hand, TripAdvisor Inc. (TRIP), one of the smallest companies in the index with a market cap of “only” about $6 billion, accounts for 0.016% of the movement of the S&P 500. Therefore, whatever happens to the price of Microsoft stock on a given day is more than 250 times as important (at least to the index) as what happens to TripAdvisor stock.
Small companies like TripAdvisor have virtually no effect on moving the index’s needle of performance.
If you look under the hood at the S&P 500, you’ll see that the five biggest component stocks account for 14.4% of the index; the 20 largest companies account for nearly 30%. This same dynamic holds true for any cap-weighted index: The biggest companies make most of the difference.
Many investors think they’re getting a meaningful amount of extra diversification from a “total market” index. But the smallest companies still represent only about 6% of the total—not enough to make much of an impact.
What if every stock in the S&P 500 had an equal influence? That would give the TripAdvisors of the world along with such names as Garmin Ltd. (GRMN), Whirlpool Corp. (WHR), Kohl’s Corp. (KSS), Campbell Soup Co. (CPB), Alaska Air Group Inc. (ALK) and Nordstrom Inc. (JWN)—all found in the bottom ranks of the S&P 500)—equal places in your portfolio with the giants like Microsoft, Alphabet Inc. (GOOG), Apple Inc. (AAPL), Facebook Inc. (FB) and Johnson & Johnson (JNJ). Those smaller stocks are still within the S&P 500, but collectively they and their sub-400-ranked peers might serve as useful diversification. There are indexes that track the S&P 500 that way, and they don’t perform quite the same as the cap-weighted index.
(You can own both a cap-weighted and an equal-weighted version of the same index, giving you an extra layer of diversification from the same group of stocks.)
In 2003, the S&P 500 Equal Weight Index was created. As the name implies, this is an equal-weight version of the popular S&P 500. The stocks are the same, but in one case Microsoft and Google and Apple are the kings, while in the other case they are mere “commoners.”
My research suggests that equal weighting the S&P 500 has added 0.25% to 1% in return. However, equal weighting in other indexes, including some that track technology stocks, has reduced returns. So investors would do better to regard equal weighting not as a panacea but as an additional layer of possible diversification.
Diversification is like having a variety of components in your portfolio. The point is to reduce your overall level of risk.
If you own a single stock, for example, you take the risk that the company could go belly-up and you lose 100%. If you own 100 stocks, there’s virtually no chance you’ll lose everything.
A major mistake many working people make is believing that stock in their company, which they presumably know well, is less risky than the S&P 500 index. But academics who studied this concluded that the risk of owning just one stock is justified only if you can reasonably expect that stock to perform seven times as well as the overall market. That’s a nice fantasy, of course. But good luck convincing your spouse it’s a reasonable expectation!
By and large, investors believe that the stocks they own are worth much more than average; that’s why they own them. I hate to throw cold water on this notion, but try as they might, and despite enormous financial incentives for cracking this particular nut, even the world’s best investors, managers and researchers have not found any consistent, reliable way to identify in advance the long-term winners in the stock market. Even Warren Buffett has had pretty average performance for most of the past 20 years.
Here are nine more things you should know about diversification.
2) The probability of anybody picking stock-market winners is much lower than you think.
A 2018 study addressed this seemingly simple question: “Do Stocks Outperform Treasury Bills?” (Hendrik Bessembinder, Journal of Financial Economics). The answer to Bessembinder’s question was a shock to many people: From a vast database of all the common stocks available since 1926, the study found that the majority of stocks—roughly four of every seven—had lower lifetime buy-and-hold returns than one-month Treasury bills.
In fact, the researchers found that they could attribute almost the entire net gain in the stock market since 1926 to just 4% of individual stocks. Collectively, the other 96% matched the gains of T-bills. That means that only roughly one of every 25 stocks was a long-term winner.
Everybody wants to identify that one in 25, but the odds against that are pretty overwhelming.
Unless you are willing to bet your financial future that you or your manager can pick many of the 4% of stocks that will be winners, I suggest you own them all, through index funds. Warren Buffett has recommended the same thing.
3) You should diversify among asset classes, too.
Even if you own 1,000 stocks, you’re still exposed to the risk that almost all similar stocks will decline significantly during a bear market (defined as a drop of 20% from a high point). This is called market risk. You can mitigate that risk by diversifying among asset classes.
For example, consider the following comparison of returns during two challenging periods for the S&P 500.
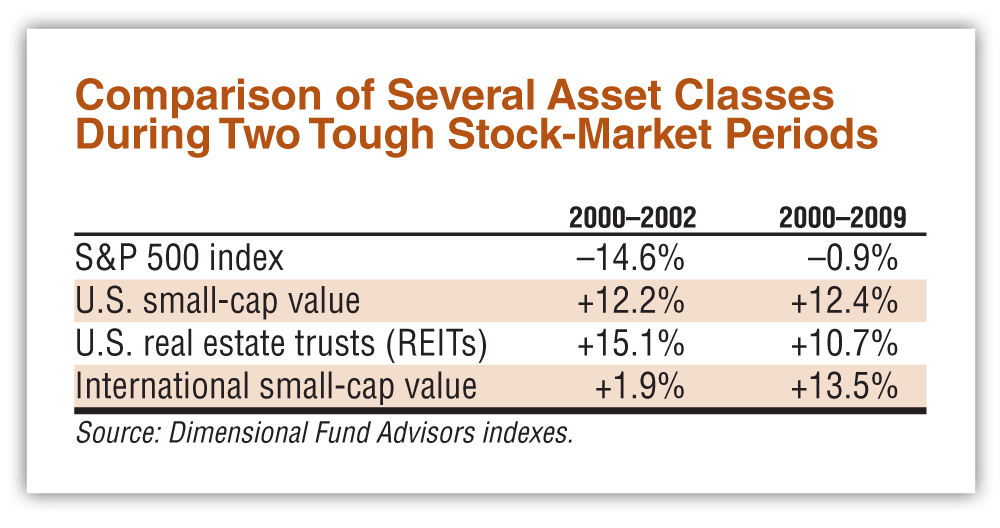
Any of these three other asset classes would have improved a portfolio based on only the S&P 500.
4) Even the best equity diversification won’t necessarily protect you from a bear market.
In 2008, the S&P 500 was down 37%, and virtually all equity asset classes were badly impacted.
In that same awful year for the stock market, long-term government bonds were actually up 25.9%, rewarding investors who diversified by holding bonds as well as stocks. (But see the following item.)
5) Are bonds a low-risk asset class? On a short-term basis, the answer is definitely yes. But in the long run, not so.
In the majority of the past 91 calendar years, after adjusting for inflation and taxes, T-bills as well as government and corporate bonds have lost money.
Bonds are good for the short term, but awful for the long term. Small-cap value stocks, to pick one example, are just the opposite: good for the long term but often harsh in the short term.
That’s just one more reason to diversify.
6) Thousands of authors, speakers, salespeople, brokers and investment advisers are happy to bend your ear with advice about all the ways you can diversify by slicing and dicing stock funds and bond funds.
You could diversify by spreading your investments among several strategies. Here are a few no-cost suggestions:
7) Here’s one you probably already know: You can diversify time itself!
If you are regularly adding money to your portfolio or if you have a substantial lump sum of cash and don’t want to invest it all at the worst possible time, turn to dollar cost averaging. This low-tech technique will ensure that you buy at a variety of prices, picking up more shares when prices are lower and fewer shares when prices are higher.
The investment industry, always eager to get its hands on investors’ money, has conducted multiple studies concluding that it’s better to invest a lump sum in the long run. In many cases that may be statistically true, but those studies ignore the peace of mind that many investors achieve by knowing they are avoiding the risk of investing everything at an awful time.
(Imagine investing your life savings or your inheritance all at once on Friday, October 16, 1987 … just before what came to be known as Black Monday, when the Dow Jones industrial average fell by 22.6%.)
8) Not all asset classes are good diversifiers.
My test for any asset class is this: Has it outperformed the S&P 500 over the long haul?
International stocks, emerging markets stocks and real estate investment trusts (REITs) all pass that test, although sometimes the answer is not crystal clear. We have reliable data for international stocks going back to 1970. In the first half of that nearly 50-year period, international stocks significantly outperformed U.S. stocks. But in the most recent quarter century, U.S. stocks have outperformed internationals.
Some asset classes clearly fail my simple test, including gold and other commodities, penny stocks and (if you want to consider this an asset class), ahem, Lotto tickets.
9) Lots of people want their financial decisions to support their ideas of a better world.
Socially responsible mutual funds have been around for years, and in recent years they’ve become available in all the major asset classes. These funds tend to have somewhat higher expenses, leading to somewhat lower returns, although the differences are much less than they were in the past.
Some investors are more likely to stay the course in tough times if they believe their investments are somehow supporting worthy causes. If that describes you, then settling for slightly lower returns could indeed be a price worth paying.
10) Diversification won’t make you a hero.
You may have heard the old line to the effect that “love means never having to say you’re sorry.” Well, along those same lines, diversification could be said to mean “you’ll always have to say you’re sorry.”
A diversified portfolio will never give you the best performance. You’ll always own some underperforming investments. (But you’ll never have the WORST performance, either, and that’s really the point.)
Finally, if you’d like to review these ideas while you’re driving or working out, I have a free podcast on the subject: https://paulmerriman.com/20-things-you-should-know-about-diversification.
—Paul Merriman and Richard Buck
The S&P 500 and total market indexes are heavily weighted to giant growth stocks. But the U.S. stock market also has value stocks and small stocks, and these subsets of the overall market don’t all perform in sync. Pretty easily and inexpensively, you can diversify your portfolio by asset classes.
Let’s back up for just a moment.
For many years I’ve been tracking and recommending a mix of assets I call the Ultimate Buy and Hold Strategy. This involves 10 equity asset classes, and the portfolio has provided impressive performance over the years. I believe it will continue to do so.
But managing and rebalancing 10 funds is too much of a chore for most investors.
A few years ago I started tracking a portfolio made up of equal parts of just four U.S. asset classes: the S&P 500, large-cap value stocks, small-cap blend stocks and small-cap value stocks. It turned out that this four-fund combination has provided most of the benefits of the 10-fund model, with a lot less work.
The data in Table 1 goes back to 1928 and shows compound rates of return for four asset classes. All four are easily accessible through low-cost index funds and exchange-traded funds (ETFs).
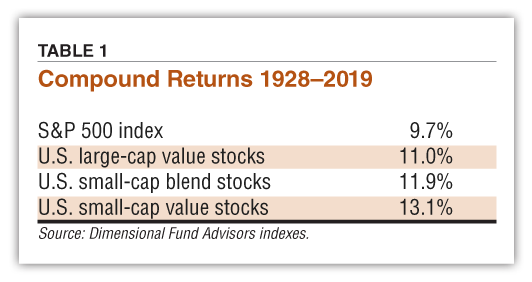
Granted, the S&P 500 should be regarded as the base of an equity portfolio. Although it’s not the most productive asset class, it is a standard benchmark for the U.S. stock market. And it is statistically the least risky of the major equity asset classes.
Going back 91 years, U.S. small-cap value stocks have been the most profitable of the 10 asset classes (and of the four), although there have been periods as long as 20 years when they underperformed the S&P 500. I recently wondered if the results would be similar going back only to 1970, a more recent period yet still long enough to be statistically meaningful.
They were, and the rest of the numbers here apply to the 49-year period of 1970 through 2018. Some of what I found was pretty impressive, as Table 2 shows.
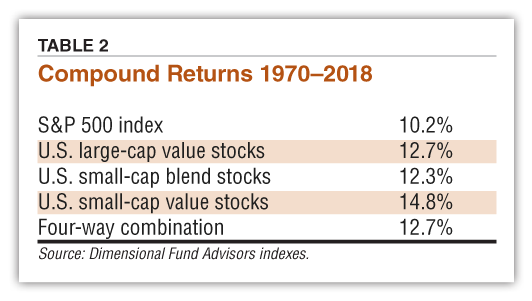
When you combine these four asset classes, giving each one equal weight and rebalancing once a year, you get a portfolio with a long-term compound return of 12.7%—slightly better than the average of its component parts.
In the real world, average one-year returns don’t mean a lot. Long-term investors shouldn’t invest for one year at a time. Most people have a plausible life expectancy into their 90s, and they are quite likely to own at least some equities until then.
With that in mind, take a look at Table 3. It shows the results of actual 40-year periods in the S&P 500 and in this four-fund combination.
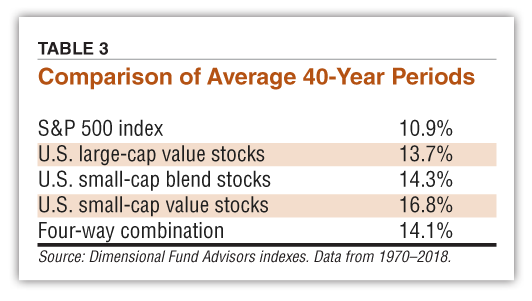
It’s no secret that three of the asset classes in this combination carry more statistical risk than does the S&P 500. But once you adopt a time frame of 40 years, you have to ask yourself: What is the real risk?
Statisticians like to fall back on standard deviation, a measure of unpredictability. But when you use standard deviation, an asset with twice the performance of a benchmark is regarded as equally “risky” as one with only half the performance.
Think about that: With standard deviation, success is regarded as a risk.
Of the people I know, I can’t think of anybody who thinks like that. The investors I know are happy to accept the best of times without getting scared. I bet that’s true for you, too.
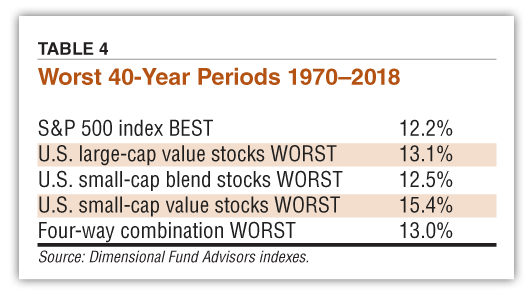
In the real world where investors actually live, a better measure of real-world risk is to look at the worst outcomes. After we calculated the outcomes of every 40-year period from 1970 through 2018, we could identify the very best 40-year returns and the very worst.
Table 4 gets right to the point—with an interesting twist. It shows that the worst 40-year period for each of the three diversifying asset classes was better than the best 40-year period for the S&P 500.
If there’s a better set of numbers to show the benefit of diversification and a long-term outlook, I don’t know what it is.
So far, we’re looking at rates of return. But to many people, those numbers seem pretty theoretical. For them, I want to translate these numbers into dollars, assuming a lump-sum starting investment of $100.
Table 5 is identical to Table 4 except that dollars are substituted for compound rates of return.
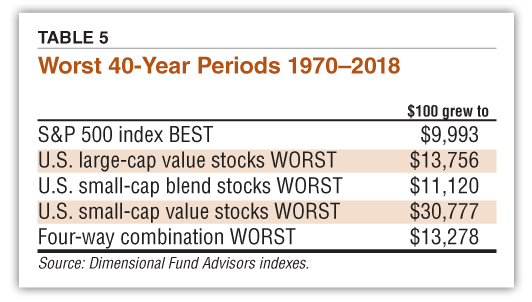
In other words, within the confines of these four asset classes, no matter what you did for any 40-year period from 1970 through 2018, you could not lose by diversifying against the S&P 500. This is why, based only on the evidence of past performance, I believe one or more of these three diversifying asset classes deserves a place in the equity part of any long-term portfolio.
If you want a reasonable shot at really superior performance and you’ve got faith and patience over a long time horizon, I think the asset class of choice is small-cap value stocks. But as you can see, either large-cap value or small-cap blend would be a good choice as well.
If you want to add some or all of the asset classes that I recommend to your portfolio, it’s not hard. All of them are available inexpensively through ETFs that I have chosen for my Best-in-Class list (https://paulmerriman.com/best-in-class-recommended-portfolios-2019), a sort of honor roll.
In an article next month, my colleague Chris Pedersen, the mastermind behind the Best-in-Class list (and my Two Funds for Life (https://paulmerriman.com/2-funds-for-life/recommendations), will explain his step-by-step process for selecting ETFs for this honor roll.
Richard Buck contributed to this article.
AAII Model Portfolios

Mutual Funds

Growth Investing

Jim L from MI posted over 7 years ago:
Rich R from MA posted over 7 years ago:
John C from CT posted over 7 years ago:
John E from UT posted over 6 years ago:
You need to log in as a registered AAII user before commenting.
Log InCreate an account