


Related
Quarterly ETF Update
Smart-beta funds vary the weighting of stocks held using factors such as valuation or size for performance that diverges from that of traditional market-cap-weighted index funds.
The need for a simple, basic long-term approach for those who do not want to be active investors prompted AAII founder James Cloonan to develop the Level3 Passive Portfolio while writing his book “Investing at Level3.”
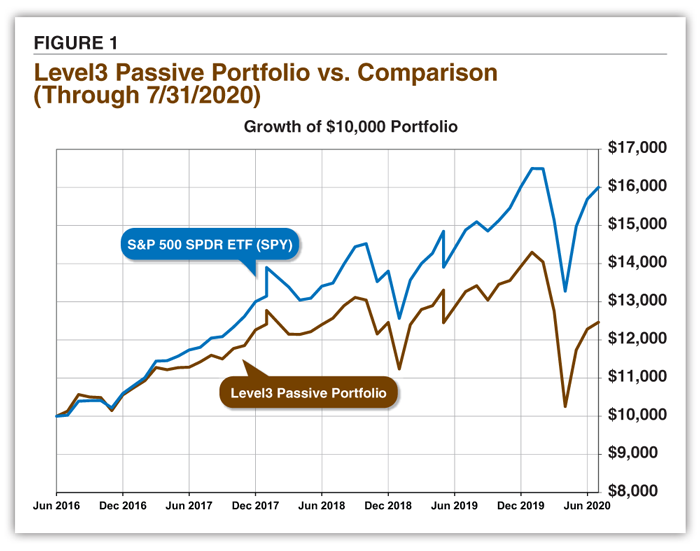
Cloonan envisioned the use of the Level3 Passive Portfolio as a complete equity portfolio for individual investors who wish to manage their own portfolio but do not have the desire to get involved in individual stock selection. It can be used as an equity portion of a whole portfolio for investors interested in selecting some individual stocks and actively managed funds, but with a desire to keep the majority of their portfolio in index funds. We started tracking the actual portfolio on May 31, 2016, as shown in Figure 1.
The Level3 Passive Portfolio is composed of four exchange-traded funds (ETFs) selected based upon long-term observations and research on market segments and strategies that had performed well over the long term relative to the S&P 500 index.
Large-cap domestic stocks as measured by the S&P 500 have offered investors a long-term annual rate of return around 10%. The Level3 Passive Portfolio looks at how investors can potentially improve upon the long-term return of the market-capitalization-weighted S&P 500 by incorporating index funds that extend the reach of the S&P 500 into smaller companies, value-oriented stocks and real estate.
In a market-cap-weighted index such as the S&P 500, the proportional weight of each company in the index is determined according to the total market value of its outstanding shares. Market capitalization (market cap) is simply the number of shares outstanding times the share price. The index is rebalanced quarterly and by its nature the price performance of its largest holdings has a greater impact on the index. The smallest company in the S&P 500 has a market cap of $1.982 billion, while the largest has a market cap of $1.842 trillion. The average market cap is $56.4 billion.
The largest company, Apple Inc. (AAPL) makes up 6.4% of the index. Apple, Microsoft Corp. (MSFT), Amazon.com Inc. (AMZN), Facebook Inc. A  (FB), Alphabet Inc. A (GOOGL), Alphabet Inc. C (GOOG), Johnson & Johnson (JNJ), Berkshire Hathaway Inc. (BRK.B), Procter & Gamble Co. (PG) and Visa Inc. (V) are the top 10 constituents and account for 27.8% of the index. With a market-cap-weighted index, popular stocks can become an overweighted segment of the index, leaving the less popular and potentially underpriced stocks underweighted. By design, smaller companies comprise a smaller percentage of market-cap-weighted indexes. Companies must have positive reported earnings over the most recent quarter, as well as over the most recent four quarters (summed together) to be added to the index. Tesla Inc. (TSLA) is now financially eligible to be added to the index and there is much speculation about its potential inclusion as it has a $342.1 billion market cap. General Motors Co. (GM) is trading with a $43.0 billion market cap. JPMorgan Chase & Co. (JPM), which fell out of the top 10 stocks by market cap since March, currently has a $303.9 billion market cap.
Changes to the Level3 Passive Portfolio should be relatively rare and will occur only when a new or different ETF is felt to be more effective at accomplishing a similar objective than one of the current holdings. Many of these ETFs are called smart-beta indexes in that they vary the weighting of stocks held in the index using factors such as valuation or size instead of the more common market-cap weighting.
 When investing in these smart-beta funds it is important to understand that they are designed to provide concentrations of segments such as value and momentum, making them more like actively managed stock funds. The performance over short periods will likely diverge (for better or worse) from traditional market-cap-weighted index funds.
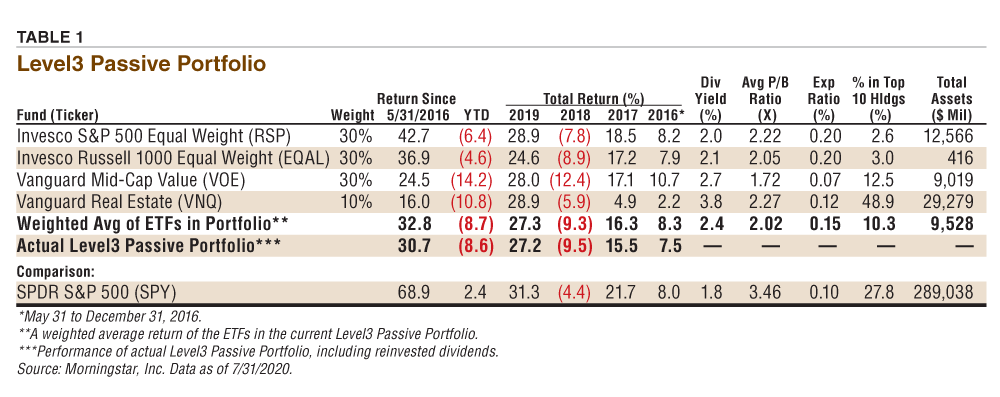
Looking at the recent performance, the Level3 Passive Portfolio continues to lag the S&P 500 since its formation. The Level3 Passive Portfolio is down 8.6% during the first seven months of 2020 compared to a NAV total return of 2.4% for the SPDR S&P 500 ETF (SPY). Growth stocks have dominated value stocks over the last decade. The same holds true of the performance of large-company stocks over small-company stocks. The recent pattern continues to test the patience of value investors. The size and value tilts within the Level3 Passive Portfolio are based upon long observations of market performance.
Table 1 provides the target weights, recent performance and basic characteristics of the ETFs in the portfolio.
(RSP)This fund is given a portfolio weight of 30% in the Level3 Passive Portfolio.
The Invesco S&P 500 Equal Weight Portfolio ETF (RSP) invests in the stocks that make up the S&P 500, but weights the holdings equally, with the holdings rebalanced quarterly. In effect, each quarter, the fund is selling the relative winning stocks that are potentially overvalued and investing the proceeds into last quarter’s losers, which might be undervalued.
The percentage of the portfolio in the top 10 holdings helps to indicate the level of portfolio concentration and serves as a measure of portfolio risk. The higher the percentage, the more concentrated the ETF is in a few companies, and the more the ETF is susceptible to the market fluctuations of these few holdings. Because the stocks in this ETF are held in equal proportion, the top 10 holdings of the Invesco S&P 500 Equal Weight ETF make up only 2.6% of total assets versus 27.8% of the market-cap-weighted SPDR S&P 500, which holds the same stocks. The top five stocks alone in the SPDR S&P 500 constitute 22.6% of the fund―Apple (6.4%), Microsoft (5.7%), Amazon.com (4.9%), Alphabet (3.3%) and Facebook (2.3%).
The dividend yield on mutual funds and ETFs is calculated by dividing the income distributions over the last 12 months by the ending net asset value. Dividend distributions for funds and ETFs are made net of expenses so that high expense ratios reduce fund dividend payments that fund owners receive. The dividend yield of the Invesco S&P 500 Equal Weight is 2.0%, just above the 1.8% yield of the SPDR S&P 500. The Invesco S&P 500 Equal Weight expense ratio is low at 0.20%, but above the 0.095% expense ratio of the SPDR S&P 500 (rounded to 0.10% in Table 1).
The price-to-book-value ratio is a common measure of company value that equates the share price to the accounting equity value of the company. The higher the price-to-book ratio, the more investors have bid up the price of the company relative to its accounting value. Value investors typically seek out companies trading with lower price-to-book ratios, and much research supports the approach. The average price-to-book value of the market-cap-weighted SPDR S&P 500 is 3.46 compared to 2.22 for the Invesco S&P 500 Equal Weight.
The total assets figure indicates the total dollars invested in the ETF and gauges the interest in the fund’s strategy. Greater total assets under management (AUM) should also result in lower expense ratios as fixed expenses are spread over a larger asset base. The Invesco S&P 500 Equal Weight has $12.6 billion in total assets. The SPDR S&P 500 has $289.0 billion in total assets.
(EQAL)This fund is given a portfolio weight of 30% in the Level3 Passive Portfolio.
The Invesco Russell 1000 Equal Weight ETF (EQAL) includes securities in the Russell 1000 index, which consists of the top 1,000 stocks by market cap. This ETF is equally weighted across the nine sector groups, with each security within the sector given an equal weighting. The fund and the index are reweighted at the close of the third Friday in March, September and December. The index is also reweighted at the close of the last Friday in June when the Russell 1000 is reconstituted. This index provides some additional exposure to mid-cap stocks over those found in the S&P 500, especially since this fund is equally weighted and not weighted by market cap. Mid-cap stocks historically have had higher returns than large caps.
The dividend yield of the Invesco Russell 1000 Equal Weight fund is 2.1%. On average, smaller companies normally payout less in dividends than larger, more mature companies but the yield of the Russell 1000 Equal Weight ETF is above that of the SPDR S&P 500 ETF, which has a yield of 1.8%, and slightly higher than the 2.0% dividend yield of the Invesco S&P 500 Equal Weight ETF. The average dividend yield of large-cap blend mutual funds is 1.3% compared to 1.0% for mid-cap blend mutual funds and 0.8% for small-cap blend mutual funds.
The average price-to-book ratio for the stocks in this fund is 2.05 compared to 3.46 for the SPDR S&P 500. The top 10 holdings constitute 3.0% of the portfolio holdings. The ETF has $416 million in total assets, the lowest in the Level3 Passive Portfolio. The expense ratio is 0.20%.
(VOE)This fund is given a portfolio weight of 30% in the Level3 Passive Portfolio.
This ETF tracks the CRSP U.S. Mid Cap Value Index, which targets stocks representing the value and lower-growing half of the mid-cap market and weights the stocks by market capitalization. CRSP classifies value securities using book-to-price, forward earnings-to-price, historical earnings-to-price, dividend-to-price and sales-to-price ratios. To measure growth, CRSP looks at future long-term growth and short-term growth in earnings per share, historical growth in sales and earnings, current investment-to-assets ratio and return on assets.
Historically, mid-cap value stocks have had higher returns than large-cap stocks or mid-cap growth stocks. The value focus of this fund helps to boost the dividend yield of the ETF. Vanguard Mid-Cap Value has a dividend yield of 2.7% compared to the SPDR S&P 500 yield of 1.8%. The average dividend yield of mid-cap blend funds is 1.0%, but mid-cap growth funds have an average dividend yield of 0.2%, while mid-cap value funds have an average dividend yield of 1.8%. Vanguard Mid-Cap Value has the lowest price-to-book value in the Level3 Passive Portfolio with a ratio of 1.72, well below the 3.46 ratio of the SPDR S&P 500 fund.
The top 10 holdings in the ETF make up 12.5% of the portfolio holdings. The ETF had 213 holdings at the end of June. The ETF has $9.0 billion in total assets. The expense ratio is a low 0.07%.
(VNQ)This fund is given a portfolio weight of 10% in the Level3 Passive Portfolio.
This ETF tracks the return of the MSCI U.S. Investable Market Real Estate 25/50 Index that measures the performance of publicly traded equity real estate investment trusts (REITs), companies that purchase office buildings, hotels and other real property. Historically, the returns of REITs have exceeded the returns of the S&P 500 over the long run and provide diversification as well.
Vanguard Real Estate has a dividend yield of 3.8%, reflecting the higher payouts common with this sector. The higher yield also makes the group more sensitive to interest rates—falling in price when interest rates rise and moving up in price when interest rates decline.
The price-to-book ratio for the holdings in Vanguard Real Estate average 2.27, compared to 3.46 for the S&P 500. The top 10 holdings account for 48.9% of the portfolio holdings, but it is worth noting that the measure is boosted at Vanguard Real Estate, as it holds 12.1% of its assets in the Vanguard Real Estate II Index Fund (VRTPX), which tracks the MSCI U.S. Investable Market Real Estate 25/50 Index. The expense ratio is 0.12% and it has $29.3 billion in assets.
For the Level3 Passive Portfolio, the initial weightings are as previously indicated and shown in Table 1. The approach to rebalancing is to keep it to a minimum.
While momentum is less of a factor with funds than it might be with stocks and transaction costs for funds can be much less than they are for stocks, rebalancing frequently is a distraction and can make taxes a significant consideration.
You should be able to achieve almost all the rebalancing necessary when you add and withdraw funds or when changes are made in the holdings.
Rebalancing decisions will have to be made by the individual since every investor will add or has added assets at a different time, so everyone’s weights will be different. But the following are some general guidelines:
The next review of the Level3 Passive Portfolio will be in the March 2021 AAII Journal. ▪
Quarterly ETF Update
AAII Model Portfolios

Portfolio Strategies

JAMES M from MT posted over 6 years ago:
MARK H from MI posted over 6 years ago:
PHILIP C from VA posted over 5 years ago:
JEAN H from IL posted over 5 years ago:
You need to log in as a registered AAII user before commenting.
Log InCreate an account