It has been noted that for outperformance of an approach to be expected to continue in the future there must be some behavioral- or risk-based explanation for the relative outperformance.
As a group, value stocks turn out to be riskier than the market. Value approaches tend to find companies that are somewhat distressed, face greater uncertainty and are weaker financially than their growth counterparts. They also tend to be riskier than growth stocks in bad economic times. Value stocks earn their long-term higher expected rates of return as compensation for their greater economic risk.
Smaller companies also owe their higher expected rates of return to their higher-risk qualities. Smaller companies normally have fewer resources to withstand economic adversity and typically possess less diverse lines of business. The stocks themselves are less liquid and fluctuate more during market moves. They tend to go through periods of underperformance relative to larger companies.
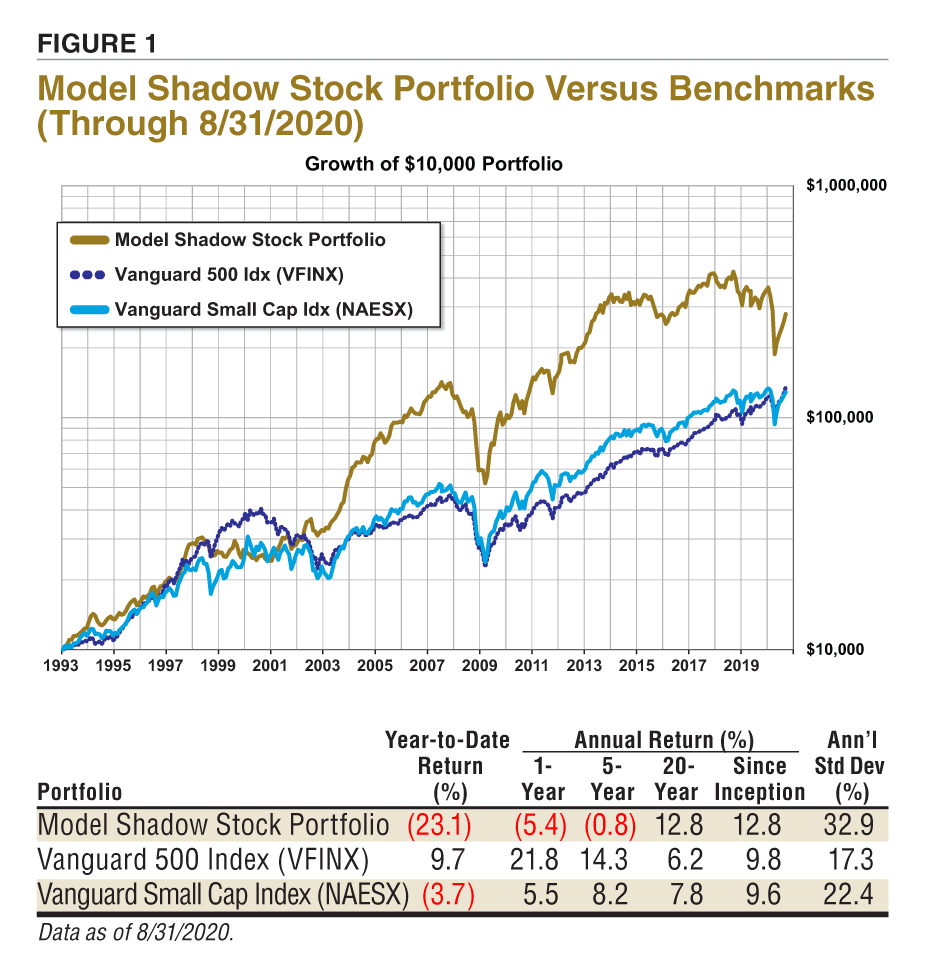
For the patient investor with the ability to withstand the higher short-term volatility and risk of micro-cap value stocks, there is the potential for strong long-term returns. As shown in Figure 1, the Model Shadow Stock Portfolio has a compound annual return of 12.8% since its inception in 1993. In contrast, the large-cap blend approach of the S&P 500 index as measured by the Vanguard 500 Index fund  (VFINX) has a compound annual return of 9.8% over the same period.
The return of the Model Shadow Stock Portfolio has been accompanied by greater volatility. It is now up 49.3% since the end of March but remains down 23.1% year to date. The Vanguard 500 Index fund has gained 36.4% since the end of March and is now up 9.7% during the first eight months of the year. The Model Shadow Stock Portfolio lost 48.5% during the first quarter, while the Vanguard 500 Index fund was down 19.6%.
As noted in the May 2020 AAII Journal, the strong relative performance of larger companies over the last 10 years has stretched their valuations relative to smaller companies. Even with the recent strong performance, small-cap stocks remained attractively priced relative to large-cap companies.
Portfolio Changes
The Model Shadow Stock Portfolio is reviewed quarterly to determine if any changes need to be made, a practice that has been in place since the portfolio’s inception in 1993. The quarterly portfolio review cycle is tied to the standard reporting cycle of most publicly traded firms in the U.S. Companies are examined for violating the earnings, valuation, size and age rules of the Model Shadow Stock Portfolio.
The primary Model Shadow Stock Portfolio selection criteria target the intersection of the smallest 10% of domestic stocks as measured by market capitalization and the “cheapest” 10% of domestic stocks as measured by the price-to-book-value (P/B) ratio.
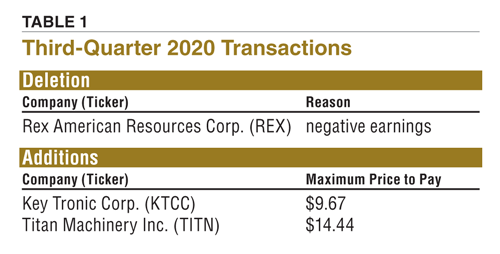
After conducting the quarterly review of the Model Shadow Stock Portfolio, REX American Resources Corp. (REX) was removed from the model portfolio. With the proceeds from the sale of REX American Resources, there was enough cash available to select two stocks that would make up an average position size—Key Tronic Corp. (KTCC) and Titan Machinery Inc. (TITN). Table 1 summarizes the changes. The detailed Model Shadow Stock Portfolio purchase and sell rules, along with portfolio management tips, are available here. Table 2 shows the current stocks that make up the Model Shadow Stock Portfolio.
Deletion: REX American Resources Corp. (REX)
REX American Resources has been on earnings probation since reporting a $1.21 loss per share for the fiscal first quarter ending April 30, 2020. On August 26, 2020, the company reported a fiscal second-quarter loss of $0.28 per share, while trailing 12-month earnings remained negative.
REX American Resources has interest in six ethanol production facilities in the Midwest, which in aggregate shipped approximately 660 million gallons of ethanol over the 12-month period ended January 31, 2020. REX American Resources also has an interest in a refined coal facility. Ethanol operations are highly dependent on commodity prices, especially prices for corn, ethanol, distillers grains, non-food-grade corn oil and natural gas. A number of factors contributed to weak performance recently including low demand for fuel, low oil and ethanol prices, a poor corn harvest in 2019, rail service delays and overall disruptions due to the coronavirus pandemic.
If a Shadow Stock that is on earnings probation reports a subsequent quarterly loss, it is removed from the portfolio.
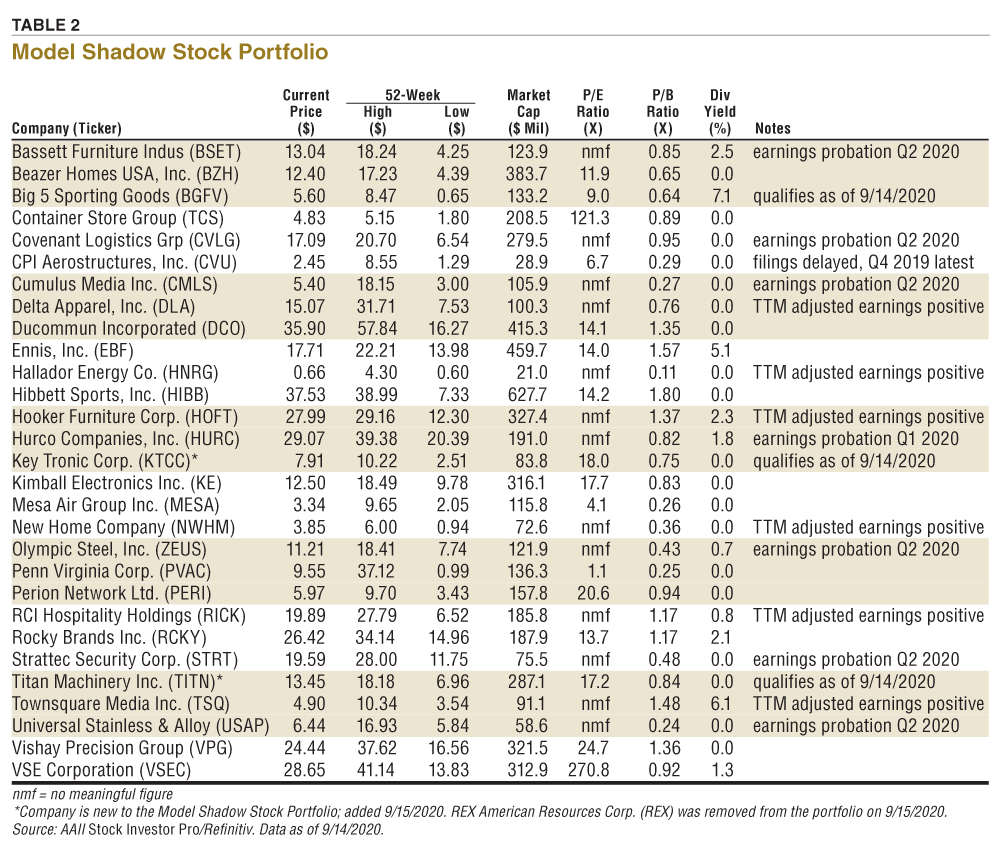
Approaching Size Limit: Stocks are sold if their market capitalization goes above three times the initial maximum criterion and there is a stock to replace it. The current market capitalization maximum for initial screening is $300 million. Stocks are marked “approaching size limit” if their current market cap exceeds 2½ times the initial criterion, or $750 million.
Approaching Value Limit: Stocks are sold once their price-to-book-value ratio goes above three times the initial criterion and there is a stock to replace it. The current initial price-to-book ceiling is 0.90. Stocks are marked “approaching value limit” if their current price-to-book-value ratio exceeds 2½ times the initial criterion, or 2.25.
Earnings Probation: If last 12 months’ earnings are negative, the stock is put on probation; if a subsequent quarter has negative earnings prior to 12-month earnings becoming positive, the stock is sold. When available, adjusted (non-GAAP) earnings are used to put stocks on probation or sell them. Otherwise, earnings from continuing operations are used. The date is the fiscal quarter during which the company first reported negative trailing 12-month earnings.
Qualifies as of: Stock still qualified as a buy when the screen was run with current data. Stocks that don’t currently qualify as a buy are held until they meet one of the sell rules.
TTM Adjusted Earnings Positive: Trailing four-quarter GAAP earnings are negative, resulting in no meaningful figure for the price-earnings ratio. However, adjusted earnings for the period are positive.
Quarterly Additions
As of September 14, nine stocks met the initial selection criteria for the Model Shadow Stock Portfolio, up from eight stocks one month ago. A generally strong stock market since the end of March, combined with weak quarterly results during the latest earnings reporting cycle has resulted in a dramatic decline in the number of qualifying companies. AAII members can see and research which companies are currently passing the initial selection criteria in the Shadow Stock Ideas table on AAII.com.
One of the qualifying stocks is already held in the model portfolio, Big 5 Sporting Goods Corp. (BGFV). The remaining eight stocks were examined to ensure adequate liquidity, timely financial filings and appropriate industry and foreign considerations. For example, the Shadow Stock Portfolio Rules currently exclude companies in the rental and leasing industry. Price momentum is used as the tiebreaker among qualifying stocks. We examined both the short-term four-week relative strength rank, as well as the weighted relative strength ranking, which looks at price performance over the last year but places a higher weight on the most recent quarterly price performance.
Addition: Key Tronic Corp. (KTCC)
Key Tronic provides electronic manufacturing services (EMS) and solutions to original equipment manufacturers (OEMs) of a range of products. The company’s service offerings include integrated electronic and mechanical engineering, precision plastic molding, sheet metal fabrication, printed circuit board (PCB) and complete product assembly, component selection, sourcing and procurement, worldwide logistics and new product testing and production. The company was organized during 1969 in Washington state as a computer keyboard manufacturer and has expanded over the years to serve a number of industries, with facilities in the U.S., Mexico, China and Vietnam.
The coronavirus pandemic impacted Key Tronic’s operations in many ways, as the company seeks to keep operations running safely while adapting to a changing mix of products and disruptions in supply. For example, demand for personal protection equipment such as sanitizing equipment increased this year, while gaming equipment declined.
No analysts are currently following the company, truly placing it in the shadows of Wall Street. Key Tronic’s most recent fiscal year ended June 27, 2020. For the first quarter of fiscal-year 2021, the company expects to report revenue in the range of $118 million to $125 million. It warns investors that while its facilities in the U.S., Mexico, China and Vietnam are currently operating and rigorously following current health guidelines, uncertainty as to the possibility of future temporary closures, customer demand and costs and future supply chain disruptions during the rapidly changing pandemic environment could significantly impact operations in coming periods.
Key Tronic was previously held in the Model Shadow Stock Portfolio. It was removed at the end of 2017 due to the implementation of the four-year rule. Stocks held for more than four years need to be up 10% per year held to avoid being removed.
Based upon the current price-to-book limit, we suggest paying no more than $9.67 per share if you wish to acquire the company with a price-to-book ratio below 0.90. Key Tronic reported its book value as $10.74 per share as of the end of June 27, 2020. To calculate the maximum buy price based on the maximum desired price-to-book ratio, multiply the current book value per share ($10.74 for Key Tronic) by the maximum price-to-book ratio to be considered for the Model Shadow Stock Portfolio (currently 0.90). The calculation is: $10.74 (KTCC) 0.9 = $9.67.
Addition: Titan Machinery Inc. (TITN)
Titan Machinery owns and operates a network of service, agricultural and construction equipment stores in the U.S. and Europe. It is engaged in four principal business activities: new and used equipment sales; parts sales; repair and maintenance services and equipment rental and other activities. It has three business reporting segments: agriculture, construction and international.
Titan Machinery currently operates a network of 74 North American dealerships in North Dakota, South Dakota, Iowa, Minnesota, Montana, Nebraska, Wyoming, Wisconsin, Colorado and Arizona, as well as 33 European dealerships in Romania, Bulgaria, Serbia, Germany and Ukraine.
Titan Machinery sells new agricultural and construction equipment. It provides in-store and on-site repair and maintenance services. It also rents equipment and provides ancillary services, such as equipment transportation, global positioning system signal subscriptions and finance and insurance products.
Its agricultural equipment segment includes sales and services tied to machinery and attachments needed for large-scale farming as well as home and garden purposes. Its construction equipment segment includes heavy construction and light industrial machinery for commercial and residential construction, road and highway construction and mining operations.
Four analysts are currently following the company. The company is expected to earn $0.798 per share for the current fiscal year ending in January 2021. The estimate is up from the $0.343 per share consensus estimate three months ago. Analysts expect earnings to expand to $0.995 per share the next fiscal year, up from $0.70 per share three months ago.
Based upon the current price-to-book limit, we suggest paying no more than $14.44 per share if you wish to acquire the company with a price-to-book ratio of 0.90 or below. Titan Machinery reported its book value as $16.04 per share as of the end of July 31, 2020. To calculate the maximum purchase price based on the maximum desired price-to-book ratio, multiply the current book value per share ($16.04 for Titan Machinery) by the maximum price-to-book ratio to be considered for the Model Shadow Stock Portfolio (currently 0.90). The calculation is: $16.04 (KTCC) 0.9 = $14.44.
Next Portfolio Review
The next quarterly review of the Model Shadow Stock Portfolio will take place following the end of November 2020. In the meantime, you can follow the portfolio in the Shadow Stocks area on AAII.com. To receive monthly email updates along with alerts to any changes made to the portfolio, please sign up at www.aaii.com/email. ▪







Ron R from IL posted over 6 years ago:
JULIAN B from OR posted over 5 years ago:
You need to log in as a registered AAII user before commenting.
Log InCreate an account