


Related

Stock Strategies
Learn who insiders are, why insider data is important and how it can be used in the investment decision-making process.

Derek Hageman leads a class in AAII's new Essential Investing Video Course. Go to https://www.aaii.com/ves for more information and to subscribe.
 AMZN
,
HOFV
AMZN
,
HOFV
Investors are paying attention to insider buying and selling activities for clues to a company’s future prospects. Since insiders have front-line knowledge of what is taking place at a company, they should be most informed about those things that will impact the company’s stock.
Such logic certainly makes sense—who else would better know the future prospects of the company and how this may impact future stock price movement? Insiders are privy to information regarding a company’s new products, operating environment and competitive dynamics. However, based on AAII’s Insider Net Purchases approach, it has not always been proven to be helpful to make effective investment decisions.
This year, insiders have been selling their company shares more than buying, as stocks have rebounded strongly from the spring’s coronavirus lockdowns. The selling is a major shift from the insider buying flurry during the market bottom in March. According to the Washington Service, a provider of insider trading and data analytics, the ratio of companies with insider buying compared to selling was at 0.27 in July, the lowest level since 2000. If a ratio is below 1.00, it means that insiders are selling more than they are buying. The ratio has come down significantly since its 11-year high of 1.75 set in March 2020. The March high provided a strong signal that insiders were confident in their company’s long-term success. These are the types of companies that the Insider Net Purchases screening approach seeks to identify.
In this article, we discuss several issues surrounding insider trading—who insiders are, why insider data is important and how it can be used in the investment decision-making process.
In legal terms, the Securities Exchange Act of 1934 defines an insider as an officer or director of a public company, or an individual or an entity owning 10% or more of any class of a company’s shares. Thus, the term “insider” refers to a wide-ranging number of groups including large shareholders, directors and officers.
Large shareholders, or “beneficial owners” as they are sometimes termed, are those persons or entities who own more than 10% of a class of a company’s stock. Although they are insiders in a legal sense, they are not privy to the same kind of information that top-level employees of the company have access to. Directors, as one may guess, are members of the board of directors of a company. Officers are those individuals at a company occupying the highest positions—CEO, CFO, president, vice president and others.
Trading by insiders based on non-privileged information is legal, albeit highly regulated by the government. The U.S. Securities and Exchange Commission (SEC) requires insiders to file several reports outlining their transaction histories.
Beyond having to report their activities to the SEC, insiders are typically limited as to when they may buy or sell the stock of a given company. When viewing the buying and selling behavior of a company’s insiders, realize that the timing of transactions is influenced by the company’s own trading rules.
How can knowledge concerning insider transactions help you in your own transactions? Insiders have front-line knowledge of what is taking place at a company. Consequently, they should be most informed about those things that will impact the company’s stock.
Research has shown that portfolios of insider buy transactions that were created on a rolling 12-month basis outperformed the market by over 7% a year during the 10-year period studied. Furthermore, two-thirds of these extra returns were earned once a 30-day period had passed since the transaction, indicating that the lag in reporting of insider transactions may not prevent outside investors from benefiting from the knowledge about the transactions. On the flip side, however, studies have shown that data concerning sell transactions tends not to be useful in garnering extra investment returns.
These studies indicate an important concept: Most insiders buy the company stock to make money, but they tend to sell company stock for any number of reasons. Insiders will probably not put up their own money unless they believe the investment will make them a profit.
If insiders have the edge in making their buy decisions, how can you use the data to judge investment opportunities? There are several ways to analyze insider data to get the most out of it.
When looking at the size of an insider transaction, you should look at it from several different angles—the number of shares transacted, the dollar value and/or the shares transacted relative to existing holdings. Obviously, you should place greater emphasis on transactions involving several thousand shares over one with only a couple hundred shares.
The dollar value of a buy transaction can be very significant. You probably wouldn’t think twice if Jeff Bezos bought $1 million worth of Amazon.com Inc. (AMZN) stock, whereas a vice president of a firm spending a year’s salary on their company’s stock could be viewed as a significant transaction.
The same can be said when viewing how many shares are transacted in comparison to the size of the insider’s holdings. Selling 10,000 shares from a portfolio of one million shares is probably not as significant as someone selling 5,000 shares from their holdings of 10,000. Overall, you need to view the transactions on a relative basis.
The type of transaction can be important as well. Purchases made on the open market tend to be more significant than options-related transactions. This is because options allow the holder to purchase stock at a discount to the current market price. An insider willing to buy the stock at full price is a positive sign.

A+ Investor subscribers can access several years of insider trading data through the Stock Evaluator.
When you are examining the insider trading activity of a company, you should pay attention to the number of insiders either buying or selling. Ideally, you would like to see several insiders acting in a similar fashion within the same relative time period. If you find insiders buying and selling simultaneously, you will want to examine the net effect, both in terms of the number of transactions as well as the number of shares. It is a more bullish indicator if insiders are net buyers rather than net sellers.
The insider’s position within the firm can also be an important consideration. The closer the insider is to day-to-day firm operations, the stronger the signal is.
Lastly, you should pay close attention to the prices at which insiders are buying and selling. You would expect to see insiders selling their stock near its high and buying near the lows. You should take note, however, if the price has been trading in a sideways manner and insiders begin buying or selling: Something besides price has probably triggered this activity.
Since there is a lag between when an insider buys or sells and when they file a report with the SEC, you also want to note where the price currently is in relation to when the transactions actually took place. If the price is significantly different from the insider’s buy or sell transaction, you may wish to hold off on placing a trade until you see confirming behavior—more buys or sells from insiders.
One item to keep in mind is that insiders tend to be early in their activity, especially when it comes to buys. Studies have shown that the majority of the extra returns that insiders generate on their buy trades come after 30 days of making the buy. Just because insiders are snatching up their company’s stock does not mean that the price will rise immediately, or at all. “Significant” insider activity—both in number of shares and number of insiders—is a better sign of long-term value.
The Insider Net Purchases screen is built into AAII’s Stock Investor Pro fundamental stock screening and research database. The companies meeting the criteria of this strategy each month are used to calculate hypothetical performance.
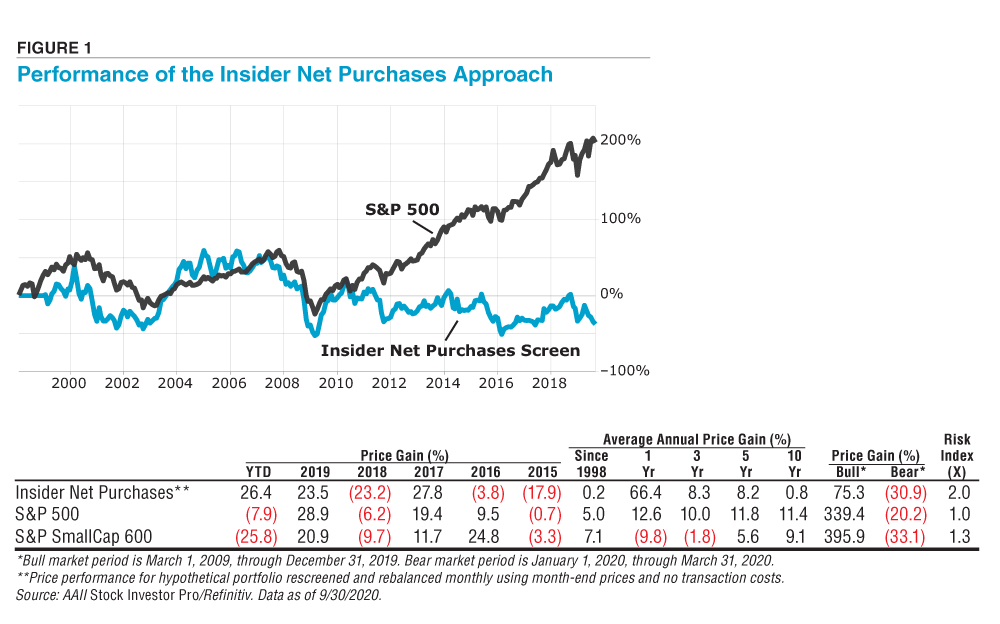
Figure 1 shows that the Insider Net Purchases approach has underperformed the S&P 500 index and the S&P SmallCap 600 index since the beginning of 1998. It has generated a compound annual price gain of 0.2% over the period from January 1998 through September 2020, while the S&P 500 is up 5.0% and the S&P SmallCap 600 is up 7.1% annually over the same period.
The strategy performed relatively poorly during the last bear market (January 2020 through March 2020), down 30.9% versus a loss of 20.2% for the S&P 500. However, the strategy outperformed the S&P SmallCap 600, which was down 33.1%. The Insider Net Purchases approach significantly underperformed during the most recent bull market (March 2009 through December 2019) gaining 75.3% compared to a cumulative price gain of 339.4% for the S&P 500 and 395.9% for the S&P SmallCap 600.
The Insider Net Purchases strategy has outperformed year to date through September 30, 2020, up 26.4% versus a loss of 7.9% for the S&P 500 and a loss of 25.8% for the S&P SmallCap 600. Research shows that insider trading activity is a valuable barometer of broad shifts in market and sector sentiment, but based on the long-term performance data above, following the Insider Net Purchases approach may be difficult to use consistently to make effective decisions.
As an AAII member, you can follow the Insider Net Purchases strategy’s performance, and see how it compares to the other stock approaches that AAII tracks, at the Screening area of AAII.com (choose Factor Screens from the dashboard). You can also see a monthly list of the stocks passing the screen.
It would be foolish to base your buy and sell decisions solely on insider data. However, before you buy or sell a stock, it may be useful to see what the inside money is up to.
The Insider Net Purchases screen first searches for those companies that have had a “significant” level of insider buying—in this case, those companies with at least three insider buys. The insider buy and sell data for this screen comes from Refinitiv, which covers those transactions in the last six months.
The second filter concerns net buying. The screen here seeks companies that have had more shares of stock purchased by insiders than have been sold over the last six months.
Thirdly, the market capitalization for the last fiscal quarter (Q1) of the passing companies is limited to between $50 million and $1 billion. These companies tend to have less of a following than large-cap companies such as Amazon.com, and companies that garner less market attention offer a greater potential for “surprises” that could allow them to offer returns greater than the overall market. In fact, research has shown that the insider buy transactions of small- and mid-cap companies have outperformed similar transactions by insiders of large-cap companies.
The next two filters exclude certain types of companies. Over-the-counter (OTC) stocks are excluded. Exchanges have listing requirements that establish minimums for company size, share availability and financial strength. Companies categorized by industry as investment holding companies, closed-end mutual funds, exchange-traded funds (ETFs) and real estate investment trusts (REITs) are also excluded.
The final criterion measures the number of net shares of stock purchased (shares purchased by insiders minus shares sold by insiders) as a percentage of the overall number of shares outstanding and requires a number greater than two.
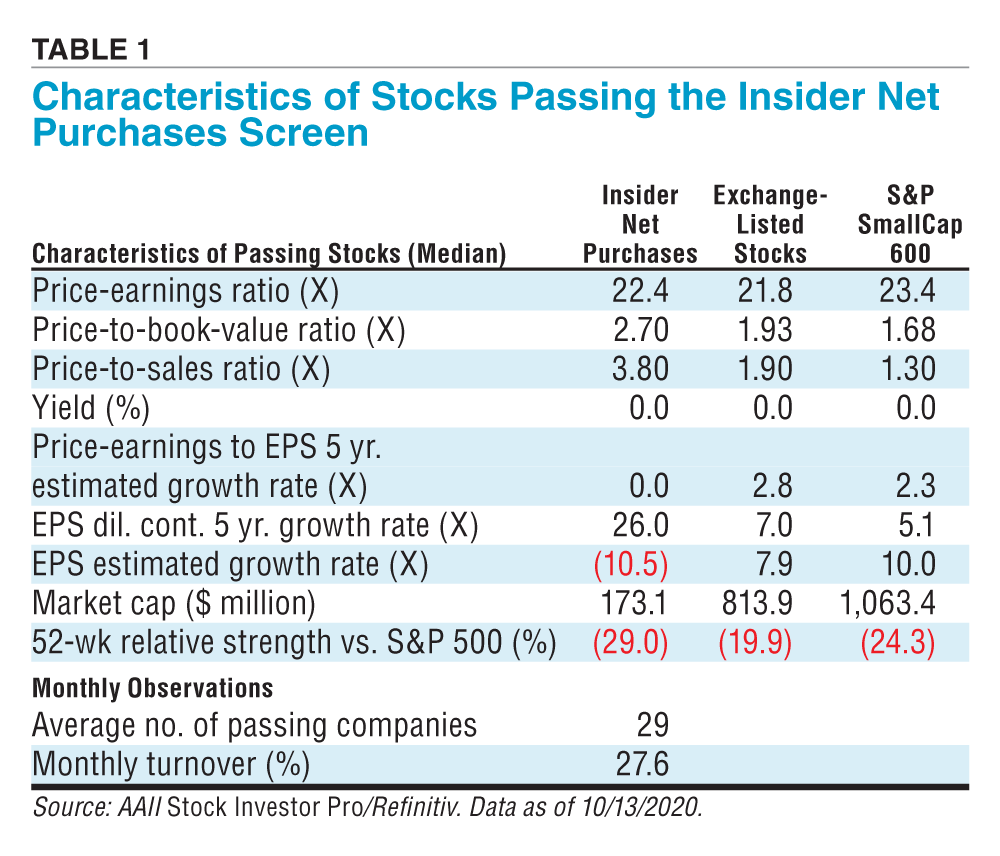
Table 1 highlights the characteristics of stocks meeting the Insider Net Purchases screening criteria as of October 13, 2020.
Many of AAII’s screening approaches search for stocks that are attractively priced relative to some measure of intrinsic worth. Of course, determining the intrinsic value is the heart of fundamental valuation. These screens usually incorporate traditional valuation metrics such as price-earnings ratio or price-to-book-value ratio as primary screening criteria.
The Insider Net Purchases screen does not have an explicit valuation metric as part of its screening filter. For the stocks currently matching the approach presented in Table 1, the median price-earnings ratio of 22.4 is above the 21.8 median value for all exchange-listed stocks, but below the median value for S&P SmallCap 600 stocks. The median price-to-book and price-to-sales ratios are also above the median values for all exchange-listed stocks and S&P SmallCap 600 stocks.
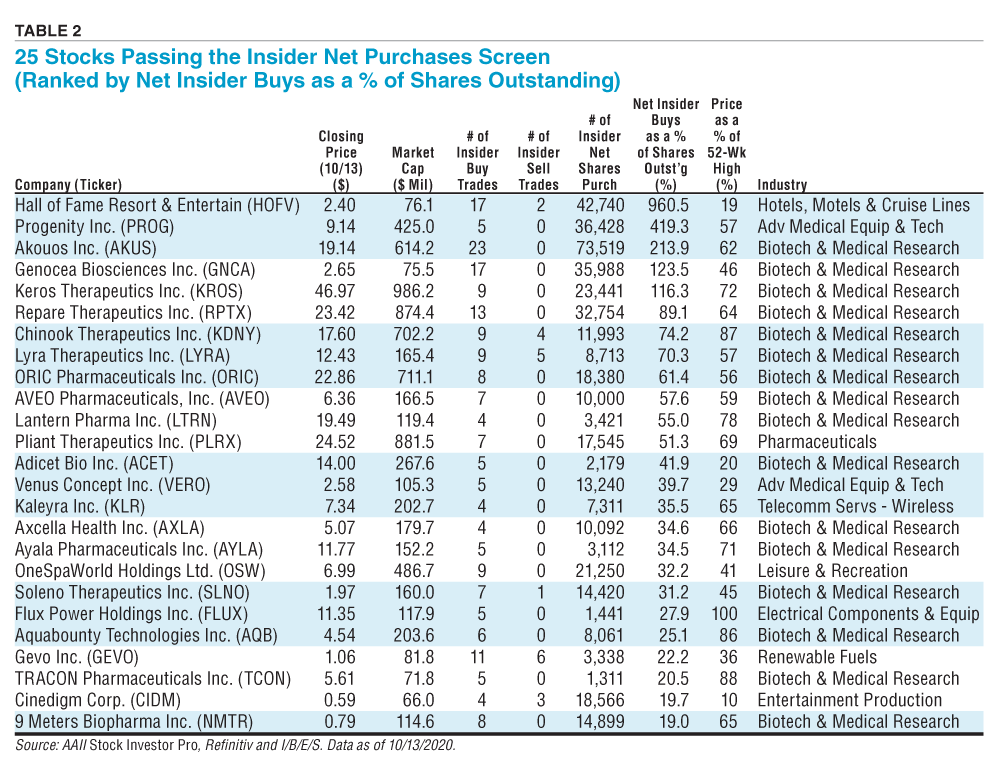
The 25 companies that met the Insider Net Purchases criteria as of October 13, 2020, are listed in Table 2 ranked by net insider buys as a percentage of shares outstanding in descending order.
Hall of Fame Resort & Entertainment Co. (HOFV), a company in the hotels industry that leverages the popularity of professional football, has 17 insider buy trades versus two insider sell trades resulting in 42,740 insider net shares purchased. The company has net insider buys as a percentage of shares outstanding of 960.5%.
The insider screen here is not meant to independently generate a list of investment candidates. Instead, these are small-cap companies that are experiencing above-average insider buying activity—a signal that they may warrant further analysis.
To buy or sell strictly on what the insiders are doing has not been proven to be a prudent investment strategy. However, to ignore what the insiders are doing may be a potential mistake.
Remember, insiders can sell their shares for a multitude of reasons. For the most part, however, insiders only buy because they expect to make money. By keeping an eye on what the insiders are doing, you have one more piece of the investment puzzle that may aid your investment approach. ▪
Stock Strategies

Stock Strategies

Stock Strategies

RICHARD L from MI posted over 5 years ago:
ANTHONY A from NC posted over 5 years ago:
CHRIS L from CA posted over 5 years ago:
LAWRENCE C from NJ posted over 5 years ago:
ROBERT A from NC posted over 5 years ago:
You need to log in as a registered AAII user before commenting.
Log InCreate an account