


Related

First Cut Mutual Funds
While it is natural to focus on the performance track record when selecting a fund, expenses and fees can have a dramatic impact on your realized rate of return.

Mutual funds provide investors with easy and generally cost-effective access to a professionally managed, diversified portfolio. While it is natural to focus on the performance track record when selecting a fund, expenses and fees can have a dramatic impact on your realized rate of return. Expenses are commonly known before you invest and are therefore under your control. They are certainly more predictable than the expected return. A fund with higher costs must perform better than a lower-cost fund to generate the same return for you.
Figure 1 illustrates the long-term drag that higher annual fees have on your realized return over time. The chart plots the growth of a $100,000 investment with an expected 6% annual investment return and various annual expense ratios. Without any annual fees, the $100,000 investment grew to just over $320,000 over 20 years. A 0.50% annual expense ratio reduces your end value by around $30,500, while a 1.00% expense ratio reduces your accumulated portfolio value by over $57,800.
Fund fees are typically classified as direct shareholder fees associated with transactions, account and sales costs and as annual fund operating expenses that are paid out of fund assets. These fees, charges and expenses are listed in a standardized fee table in the fund’s prospectus. Many websites, including AAII.com, also normally report these fees and expenses when presenting fund information.
Some funds sold through brokers impose a range of sales loads or charges to compensate the broker. There are two basic types of sales loads—a front-end load is paid when you purchase fund shares while a back-end or deferred sales load is paid when you redeem fund shares.
A front-end load immediately reduces the money invested in a fund, reducing the ability to grow your investment. For example, if you were to invest $100,000 in a fund with a 5% front-end load, $5,000 ($100,000 × 0.05) would go to the broker, leaving $95,000 to invest in fund assets. Front-end loads will sometimes have certain breakpoints so that the commission percentage rate goes down the more you invest.
With a back-end load, also often called a deferred sales charge, your sales commission is paid when you redeem your shares. In this example, your $100,000 investment would be initially fully invested. When you redeem the fund investment, typically the commission fee is determined as the lower of the initial investment or the value of shares at the time of redemption. So, if your $100,000 investment has grown to $125,000, the back-end load would be based upon your initial investment of $100,000 and you would receive $120,000 ($125,000 less the $5,000 commission on the $100,000 initial investment). However, if the investment value had declined to $75,000, the sales load would be calculated as $3,750 and you would receive $71,250 when the shares were redeemed.
The back-end load will often vary depending upon the time held before the shares are redeemed. These are termed contingent deferred sales loads and the fund prospectus will provide the time frame of the reductions.
A redemption fee is paid at the time you redeem your shares and is typically calculated against the full value of your redemption. Unlike a back-end load, the redemption fee is not used to pay the broker. Instead, the money is paid directly to the fund to help defray the costs associated with the redemption.
An exchange fee is imposed by some fund families when you redeem shares in one fund and purchase shares in another fund offered by the fund family.
Account fees are fees that some funds charge in connection with the maintenance of your account. For example, some funds impose an account maintenance fee on accounts valued at less than a certain dollar amount.
A purchase fee is paid upon investing in a fund, but the proceeds of the fee are paid directly to the fund and not as a commission to the broker.
The annual fund operating expenses are paid directly out of fund assets and imposed continuously. They are calculated and presented as an annual expense. You are paying these fees and commissions indirectly, yet they reduce your realized rate of return. They are expressed as a percentage of assets and they add up to the expense ratio.
The management fee is paid out of fund assets to the fund’s investment adviser for managing the investment portfolio and to cover the administrative expenses.
Distribution and service (12b-1) fees are paid directly out of fund assets to cover the costs of marketing and selling the fund shares and sometimes shareholder service expenses. They are commonly termed 12b-1 fees after the U.S. Securities and Exchange Commission (SEC) rule that authorizes a fund to pay them. Funds can charge up to 0.25% in distribution fees and still describe themselves as no-load funds.
There is also an “other expenses” category within the annual fund operating expenses to account for items such as legal and accounting expenses.
The total of annual fund operating expenses is more commonly referred to as the expense ratio. The expense ratio represents the sum of the fund’s annual operating expenses and is expressed as a percentage of the fund’s average net assets. All mutual funds and exchange-traded funds (ETFs) charge their shareholders an expense ratio to cover the fund’s total annual operating expenses.
The prospectus fee table also provides the total costs of these fees and charges to an investor over time. The illustration in the prospectus assumes an initial investment of $10,000 and 5% growth rate for the fund and states the total dollar cost to an investor if shares were redeemed at the end of one, three, five and 10 years. It allows you to better compare one fund to another while considering the many share classes that are often offered with different front, back and annual sales and expense fees.
Fund expenses count and they count more for some investment categories than others. The general rule is that if you invest in a fund that has a significantly higher expense ratio than the average for its category, the long-term performance drag will be costly.
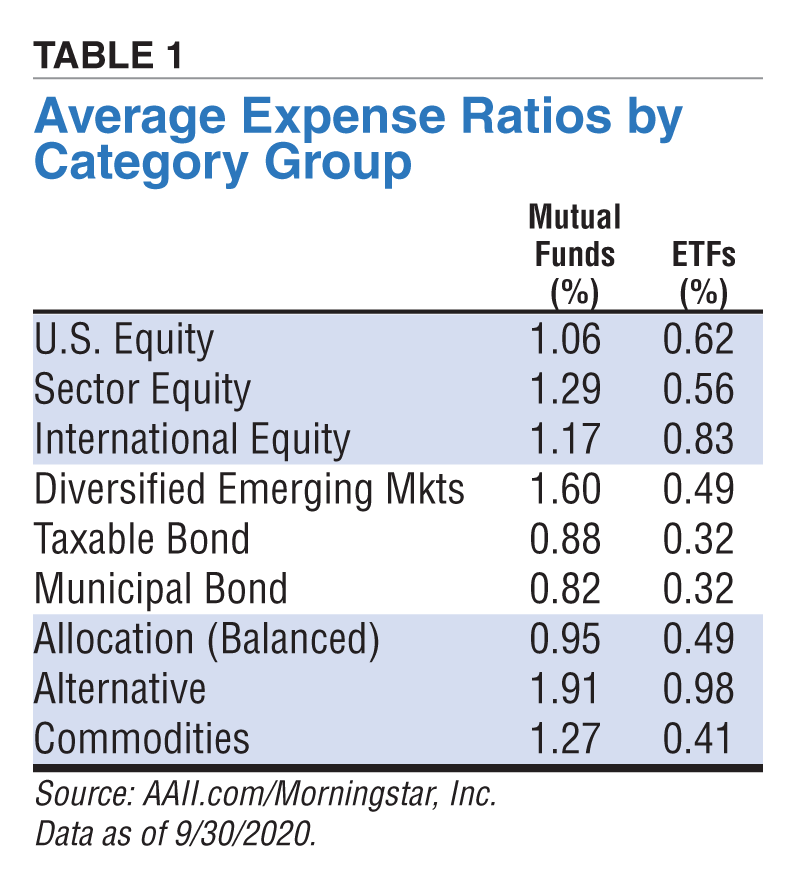
Stock funds are more expensive to manage than bond funds, international funds are more expensive than domestic funds and funds with larger asset bases are cheaper than small funds. Expense ratios for ETFs tend to be lower than for traditional open-ended mutual funds. Table 1 reports the average expense ratios for fund and ETF categories.
Before purchasing any fund, it is helpful to examine the prospectus and the fee table that should be near the front of the document.
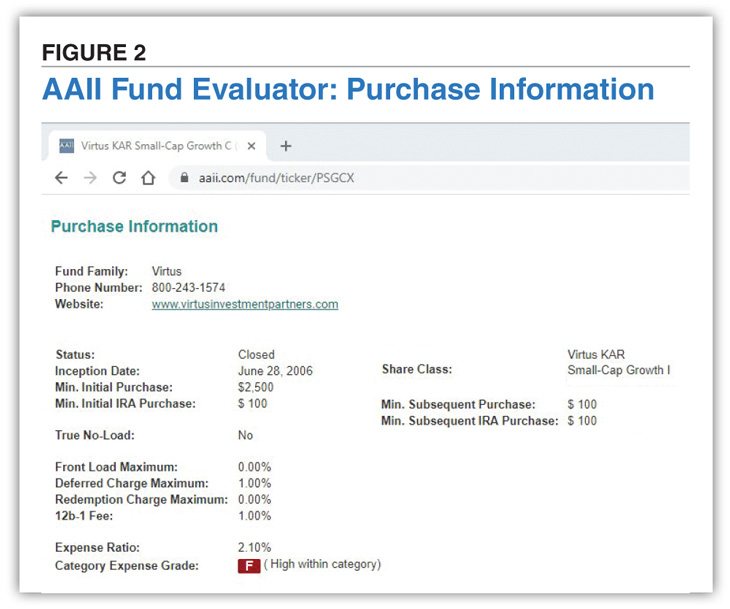
When researching any fund or ETF on AAII.com, the purchase information section notes any loads or fees levied by the fund. The expense ratio is also listed, along with a category expense grade that indicates if the expense ratio is low (A), below average (B), average (C), above average (D) or high (F) within the fund’s category. A link to the fund’s website is also provided to access the fund prospectus. Figure 2 shows a sample of the purchase information section of AAII’s Fund Evaluator; this and the ETF Evaluator are accessible to any AAII member by typing a fund name or ticker in the Search at the top of AAII.com.
It is best to favor funds with lower expense ratios. Every dollar spent on fund expenses and loads is a dollar you will never see again.
First Cut Mutual Funds

Mutual Funds

Portfolio Strategies

BUD S from WA posted over 5 years ago:
BARRY J from TX posted over 2 years ago:
You need to log in as a registered AAII user before commenting.
Log InCreate an account