


Derek Hageman leads a class in AAII's new Essential Investing Video Course. Go to https://www.aaii.com/ves for more information and to subscribe.
Even in a normal year, U.S. stocks had a tough act to follow after the longest bull run in U.S. market history ended. But as we know, 2020 wasn’t a normal year, it was unprecedented. We experienced one of the worst pandemics in history.
Coronavirus. Stay-at-home orders. Mandatory shutdowns. Social distancing. Bear market. Massive stimulus. Markets rally. Presidential election. Vaccine hope. In many respects, we have never seen a year like 2020. That applies to the financial markets as well.
The S&P 500 index’s 35.0% plunge in 33 calendar days was the fastest collapse of that magnitude in its 63-year history, erasing roughly $16 trillion in wealth. The Dow Jones industrial average rose at least 1,000 points in a single day eight times. Before this year, it had only done this once. The CBOE Volatility Index (the VIX)—the market’s collective “fear gauge”—hit an all-time high of 85.5, eclipsing the previous record set during the Great Recession. Crude oil prices traded below zero in April when a massive supply glut crushed short-term demand.
Then, thanks to trillions in government stimulus, the markets recovered faster than at any other time in history and are hitting new highs. Year to date through the end of November 2020, the S&P 500 index was up 12.2% on a total-return basis. The Dow added 4.0% for the year and the Nasdaq composite rose 40.8% through the close on November 30.
As we go to press in mid-December with the January issue, the markets continue to hit new highs even as millions of people remain unemployed and small businesses struggle. Recently, the Dow climbed above the 30,000 level for the first time in its history. The Dow, S&P 500 and Nasdaq soared to all-time highs on December 18, 2020.
Yet as we look at the year in review, the lessons investors can learn are for the most part familiar ones. In that regard, 2020 did not lead to major financial revelations as much as it reinforced proven investment principles. The rules that will lead you to successful long-term investing remain as true as ever.
Maxims Endure in Pandemic
Ignore the doomsday predictions. The U.S. economy has withstood dozens of “disasters” and overcome all of them. The coronavirus pandemic is the latest example. Volatility creates opportunity. Every bear market and recession are different, but the one common theme is that all of them are followed by a recovery. It was impossible to know in March how long it would take stocks to recover from their coronavirus collapse, but history made it clear that a rebound was inevitable. Corrections create buying opportunities.
Don’t fight the Fed. Yes, we’ve all heard this adage countless times. It’s still true. Despite concerns that near-zero interest rates left the Federal Reserve low on ammunition, Fed chair Jerome Powell’s “whatever it takes” approach proved once again that central bank policy is perhaps the most significant near-term driver of asset prices.
2020 Performance of AAII Stock Strategies
AAII has been developing, testing, refining and tracking a variety of quantitative stock strategies for over 20 years using Stock Investor Pro, AAII’s fundamental stock screening and research database program. Many of these methodologies follow the approaches of popular investment professionals, while others are tied to basic investment principles. These strategies cover a wide range of investment styles, from those that are value-based to those that focus primarily on price momentum and growth.
While this annual recap article discusses the best- and worst-performing strategies for 2020, you can also review the long-term performance and see how these strategies performed in up and down markets.
Table 1 summarizes the performance and variability of the screening strategies AAII tracks, with the guru and factor screens ranked separately in descending order by year-to-date price change through the close on November 30 (see the AAII Stock Ideas box further below for more information about them). Table 1 also presents the price change performance (excluding dividends and transaction costs such as commissions, bid/ask spreads, time and price slippage, etc.) over various periods for each approach. The screening strategies are categorized based on the “factors” that underlie each strategy. A key at the bottom of the table explains the initials; for a full description of the factor categories of AAII Stock Screens, see the box at the end of this article.

Download Table 1 Excel Spreadsheet

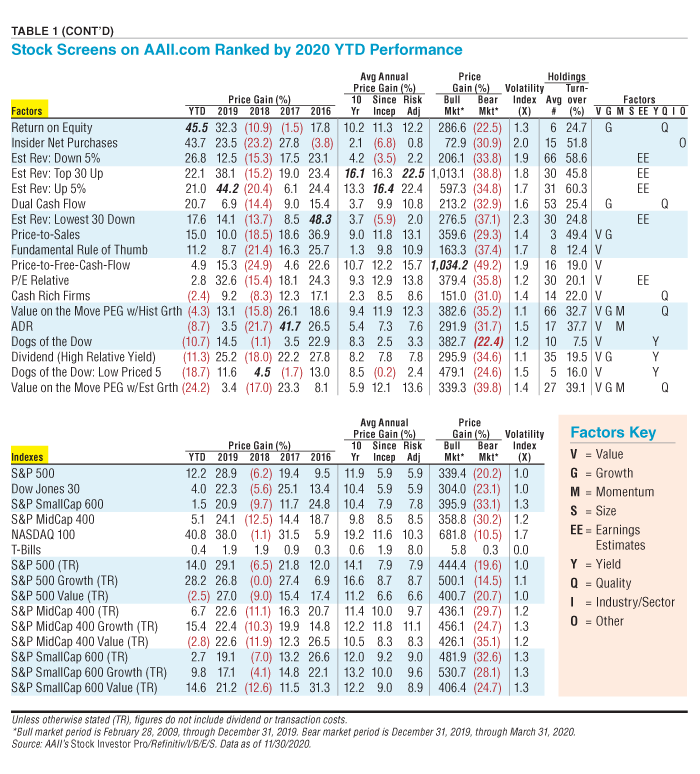
Among the 60 stock screening strategies AAII tracks, all but six posted gains over the last 10 years (as of November 30, 2020). Fourteen of the 60 screening methodologies AAII tracks posted better price returns than the S&P 500 over the last 10 years. Looking at the performance for the 60 AAII stock strategies this year in Table 1, you can see that 2020 was a generally positive year for quantitative stock screening. Thirty-seven of the 60 AAII screening strategies were up for the year through the end of November. Twenty-six of the AAII screening strategies outperformed the S&P 500’s price gain (excluding dividends) of 12.2%. [Editor’s note: The price gain for the index is used instead of total return, since the impact of dividends is not included in the performance of the AAII screening approaches.]
For 2020 (through November 30), the top AAII guru strategy is the Inve$tWare Quality Growth screen, a growth-oriented factor strategy. This approach led all AAII strategies with a 100.3% gain through the first 11 months of the year. The Inve$tWare Quality Growth methodology is experiencing its best year since 1998.
For the third consecutive year, the Foolish Small Cap 8 guru strategy, which blends growth, momentum and size factors was the second-best-performing approach of all 60 AAII stock screening strategies. The Kirkpatrick Value screen is delivering its best year since 2007 with a gain of 54.1%.
The Inve$tWare Quality Growth and Foolish Small Cap 8 screens rank among the 10 most favorited screening strategies. AAII members can favorite a screen by clicking on the star next to a screen’s name. Favoriting gives an insight into the screening strategies that real investors are following right now. The two most favorited screening strategies are O’Neil’s CAN SLIM Revised 3rd Edition and Stock Market Winners.
The top AAII factor approach for 2020 is the Return on Equity strategy, which is a commonly used measure of profitability and corporate management excellence.
Following a multi-year trend, growth-oriented strategies did better at the large- and mid-cap levels, while value-focused strategies outperformed growth among small-cap stocks. Through the end of November, the S&P 500 Growth index posted a total return—including dividends—of 28.2%, while the S&P MidCap 400 Growth index and S&P SmallCap 600 Growth index had year-to-date total returns of 15.4% and 9.8%, respectively. The strength of growth investing is also reflected in the return of the Nasdaq 100 index, which includes the 100 largest nonfinancial companies listed on the tech-heavy Nasdaq Stock Market. For 2020, the Nasdaq 100 had a price gain of 40.8% through the end of November.
In comparison to growth investing, value investing struggled this year at the large- and mid-cap levels. The total return of the S&P MidCap 400 Value index was negative 2.8% through the end of November, while the S&P 500 Value index posted a year-to-date total return of negative 2.5%.
The AAII Stock Ideas
AAII has been developing, testing and refining a wide range of screening strategies over the years. Many of the screens follow the approaches of popular investment professionals, while others are tied to basic principles of investing. These approaches run the full spectrum, from those that are value-based to those that focus primarily on growth, while most fall somewhere in the middle. Screens following the approach of an investment professional do not represent their actual stock picks. The rules of each screen are defined by our interpretations of their respective investment approaches. The results of the screening strategies, as well as the criteria for each screen, are programmed into the Stock Investor Pro program and can also be accessed via the Screening page of AAII.com. Each month, 60 separate screens are performed using AAII’s Stock Investor Pro and the current companies passing each screen are reported. Subscribers to A+ Investor or Stock Investor Pro can see results on a daily basis. The screening results are found at the Screening page of AAII.com, posted early each month using data from the previous month’s end. The weekly AAII Stock Ideas email discusses stock ideas using a featured screen or the new A+ Grades. You can sign up for this complimentary newsletter at www.aaii.com/email.
The performance of the stocks passing each screen is tracked on a monthly basis. The month-to-month closing price is used to calculate the return, with equal investments in each stock at the beginning of each month assumed. The impact of factors such as commissions, bid/ask spreads, time slippage (the time between the initial decision to buy a stock and the actual purchase) and taxes is not considered. This overstates the reported performance, but all approaches are subject to the same conditions and procedures. Higher turnover portfolios typically benefit more from these simplified rules. Keep in mind, however, that performance figures for the AAII stock screening strategies represent price change only, and do not include dividend payments or dividend reinvestment. Therefore, the results of screens that tend to isolate large, dividend-paying stocks—such as the Dogs of the Dow (in the value category)—do not receive a boost from dividend payments or reinvestment. The 10 stocks passing the Dogs of the Dow screen at the end of November were yielding 4.1%, compared to 3.6% at the end of November 2019; investors holding shares in these stocks, therefore, would have a higher annual return by approximately this amount for the coming year.
Sell rules are the same as the buy rules: The hypothetical portfolios are completely reallocated using each subsequent month’s data. Thus, a stock is sold (no longer included in the portfolio) if it ceases to meet the initial criteria, and new stocks are added if they qualify. Note that we use these rules for backtesting purposes but do not necessarily advocate them as part of a real-world investment framework. Stocks that no longer qualify are dropped even if the strategist behind a particular approach suggests different sell rules versus buy rules. This may shorten the holding period and increase the turnover relative to what the strategist would suggest for an actual portfolio.
Top Factor Strategy for 2020
As indicated, the top AAII factor strategy for 2020 is Return on Equity, which has generated a price return of 45.5% through the end of November. This is the first year the approach has risen to the top of the factor strategy list on an annual performance basis. The Return on Equity approach is experiencing its best year since 2003.
The primary goal of the screen is to identify companies with consistently high returns on equity. Secondarily, the AAII approach includes characteristics to filter out firms with relatively high levels of debt, low relative margins and a better-than-industry-median level of asset turnover.
The AAII Return on Equity approach starts by seeking out companies operating with a return on equity (ROE) 1.5 times their respective industry median over the last 12 months and each of the last five fiscal years. This screen helps to reveal companies whose management has consistently generated the highest profits from its equity capital. The AAII Return on Equity strategy does not simply screen for companies with ROE levels of 20% or higher, but instead looks for ratios that are high relative to industry norms to highlight firms that are better at generating profits than their peers.
Top Guru Strategy for 2020
The Inve$tWare Quality Growth screen is the top AAII guru screen year to date, gaining 100.3% through the end of November. The methodology is based on the National Association of Investors Corporation’s (NAIC) philosophy of selecting reasonably priced stocks of “good quality” companies that merit further investigation. The NAIC adopts a simple buy-and-hold, fundamental approach to growth investing.
The Inve$tWare Quality Growth screening strategy seeks to identify growth companies with:
- Sales over the trailing 12 months greater than or equal to $100 million,
- At least five years of public trading,
- Growth in sales of at least 7% a year over the last one-, three- and five-year periods as well as fully diluted earnings per share from continuing operations of at least 14.9% over the same periods,
- Coefficient of determination (R2) over the last seven years for sales growth and fully diluted earnings from continuing operations growth greater than or equal to 95%,
- Operating margin for the last 12 months greater than or equal to 95% of the company’s five-year average operating margin,
- Operating margin for the last 12 months greater than or equal to the industry’s median operating margin for the same period,
- Return on equity for the last 12 months greater than or equal to the industry’s median return on equity for the same period and
- Estimated growth rate in earnings per share of at least 14.9%.
The Weakest Strategy for 2020
The weakest overall AAII stock screening approach for 2020 is the T. Rowe Price screen, down 31.2% through the end of November. Combining factors of value and growth, the T. Rowe Price strategy focuses on growth stocks but avoids over-glamorized stocks. The T. Rowe Price approach looks for stocks that rank in the top 25% of all U.S.-listed stocks in terms of three-year growth rate in earnings per share that satisfy the following elements:
- Growth in earnings per share over the last five- and seven-year periods that rank in the top 50% of all U.S.-listed stocks,
- Price-earnings ratio is less than the five-year average price-earnings ratio,
- The average price-earnings ratio for the last five years is less than 40 and the five-year average price-earnings ratio is less than 40,
- Insider ownership of at least 20% of the outstanding shares,
- Payout ratio for the latest 12 months is less than 100%,
- Positive cash flow for the last fiscal year,
- Return on assets for the latest 12 months is greater than the industry’s median return on assets for the same period,
- Net profit margin for the latest 12 months is greater than the industry’s median net profit margin for the same period,
- Net profit margin for the latest 12 months is greater than or equal to the net profit margin for the last fiscal year and is greater than the net profit margin five years ago,
- Operating profit margin for the latest 12 months is greater than the industry’s median operating profit margin for the same period and
- Operating profit margin for the latest 12 months is greater than or equal to the operating profit margin for the last fiscal year and is greater than the average operating profit margin for the last five years.
There were 22 AAII screening strategies that were down for the year through the end of November. Eight of the AAII screening strategies posted their worst performance since 2008, including Dogs of the Dow Low Priced 5, Dogs of the Dow, Dreman, Driehaus Revised, Graham—Defensive Utility Investor, Stock Market Winners, T. Rowe Price and Value on the Move—PEG With Estimated Growth. All of these strategies emphasize the value factor. The Driehaus Revised screen, which seeks growth and momentum, is the exception. It is the first time in 11 years that the Stock Market Winners screen generated a negative return; it’s a value-growth-momentum strategy developed by Marc Reinganum and based on a publication by William O’Neil & Co. titled “The Greatest Stock Market Winners: 1970-1983.”
Combining factors of quality and value, the Piotroski High F-Score and the Magic Formula approaches have both generated negative returns for the last three years through the end of November.
10-Year Performance
Because this is an annual recap article, Table 1 ranks all the screening strategies that AAII tracks based on year-to-date price change. However, saying that a strategy is “good” or “bad” based on one year of performance isn’t practical or realistic because most of us have a longer-term period for investing.
Therefore, Table 1 also shows performance for the AAII stock screening strategies over a longer period—specifically based on average annual price gain over the last 10 years and since inception. Ten years is typically a long enough period to be meaningful and long enough to capture at least one full economic cycle.
The top AAII guru screen (and overall), O’Neil’s CAN SLIM Revised 3rd Edition strategy, overtook the Stock Market Winners approach to move to the top of the list with an average annual price gain of 16.6% a year over the last 10 years.
O’Neil’s CAN SLIM Revised 3rd Edition strategy has a strong appeal to the active investor looking for growth stocks. William O’Neil founded the business newspaper Investor’s Business Daily. He is also the author of “How to Make Money in Stocks,” where he introduced the CAN SLIM investment strategy. While the approach is specific, O’Neil stressed the art of investing when interpreting the direction of the market. The CAN SLIM approach uses fundamental company and industry factors to identify attractive stocks and employs technical price and volume analysis to help determine when to buy and sell. O’Neil’s CAN SLIM strategy seeks companies with a history of strong and consistent annual earnings growth, quarterly earnings momentum, strong relative price strength and support from leading institutions.
For the second consecutive year, the Estimate Revisions Top 30 Up screen is the top AAII factor strategy over the last 10 years. It has an average annual price gain of 16.1%. The Estimate Revisions Top 30 Up strategy looks for stocks that have seen upward revisions over the last month to their annual consensus earnings estimates for the current fiscal year and next fiscal year, with no downward revisions. The strategy then tracks the 30 companies that have seen the largest percentage change in the current-year consensus estimate over the last month.
Among the worst performers over the last 10 years, six strategies have negative average annual price returns, up from four at this time last year. Despite strong performance in 2020 year to date, the Muhlenkamp strategy is still at the bottom of the list, with an average annual loss of 8.3% a year over the last 10 years. This approach looks for companies with above-average returns on equity, a reasonable price-earnings ratio based on prevailing inflation and interest rates, positive long-term earnings growth, profit margins that exceed the industry norm, a ratio of liabilities to assets that is below the industry norm and positive free cash flow.
The next two strategies with negative 10-year performance are Schloss (5.3% average annual loss) and Lynch (average annual loss of 3.5% a year over the last 10 years). None of the AAII stock screening factor strategies have negative 10-year performance data.
Risk-Adjusted Returns
Table 1 also presents the risk-adjusted return for each of the strategies that AAII tracks. This calculation adjusts the performance of each approach using their volatility as measured through standard deviation of returns, penalizing screens with higher standard deviations (for a more detailed explanation of the risk-adjusted return calculation, see the Calculating Risk-Adjusted Return box on page 24). Using risk-adjusted returns since inception (1998), the three best-performing strategies are Estimate Revisions Top 30 Up (+22.5%), Estimate Revisions Up 5% (+22.4%) and O’Shaughnessy Tiny Titans (+22.0%).
Calculating Risk-Adjusted Return
The formula for calculating the risk-adjusted return is as follows:
Margin Rate + (Benchmark Std Dev ÷ Portfolio Std Dev) × (Portfolio Return – Margin Rate)
Where:
- Margin Rate = margin rate (the rate at which you borrow funds); we currently use 8.25% for our calculations (down from 9.0% a year ago), which is the current base rate at TD Ameritrade
- Benchmark Std Dev = standard deviation of the benchmark, in this case the S&P 500 index
- Portfolio Std Dev = standard deviation of the portfolio of stocks passing a given stock screen
- Portfolio Return = return of the portfolio invested in the stocks passing a given stock screen
This calculation assumes that the portfolio return for a given stock screen is higher than the margin rate. If it isn’t, the risk-adjusted return calculation would be as follows:
Margin Rate + (Portfolio Std Dev ÷ Benchmark Std Dev) × (Portfolio Return – Margin Rate)
Following this methodology, we calculate the risk-adjusted returns since inception for all of the AAII Stock Screens.
Only one of the AAII stock screening strategies has a negative average annual risk-adjusted return, down from six a year ago. On a risk-adjusted basis, the Murphy Technology approach is once again at the bottom with an average annual risk-adjusted loss of 1.6%. This screening strategy looks for technology and telecommunications companies that have been growing sales by at least 15% a year over the last three years, as well as net margins and ROE of at least 15%, among other criteria.
Conclusion
The stock screening strategies are intended to be an educational resource to show what types of filters and strategies work over varying market conditions. They are not portfolios nor are they intended to be a buy or recommended list. At best, you should view them as idea generators. You should analyze the passing stocks further before deciding whether to commit real dollars to them. Furthermore, since market conditions change, it is important to be adequately diversified.
One way to achieve sufficient diversification is to select stocks from multiple stock screening methodologies. However, it is not enough to simply choose those strategies that have the best long-term performance. Instead, it is useful to understand the forces influencing both the overall market and a strategy’s performance, and how changing economic conditions can impact both the market and individual stocks. Examining the characteristics of an investment methodology may reveal some practical problems you might face when trying to translate quantitative stock screening into real-world portfolio building.
Something else to keep in mind is that once you decide on which methodologies to follow, you cannot just let the quantitative screens choose your stocks. Screening is a multi-step process. For some investors, this means first applying quantitative filters such as the screens we have discussed here to help you arrive at a set of candidates that all share the same base set of characteristics. This does not necessarily mean they are all good investments. It is important then to perform at least cursory qualitative analysis to decide whether they are right for your stock portfolio. ▪
Factor Categories of AAII Screening Strategies
Value (V)
The foundation of value investing is the notion that cheaply priced stocks outperform more expensive stocks in the long term. Value has several dimensions: the stock price as a multiple of company earnings, price as a multiple of book value and other such ratios. Comparing a company’s price-earnings (P/E) ratio to its forecasted or historical earnings growth is also used (PEG ratios). Academics and investors differ on which measure best represents a value company. The value factor has a long history in financial research starting in the 1930s when academics developed a methodology for identifying stocks trading less than their actual value. However, the best-known work on the value factor was carried out by Eugene Fama and Kenneth French in their 1992 paper, “The Cross-Section of Expected Stock Returns,” which concluded that a low price-to-book ratio was the most predictive definition of value.
Screening strategies are tagged as “value” if they contain filters that look for stocks with low price multiples on either an absolute or relative basis; have price multiples that are low based on historical averages or sector/industry norms; or have price multiples that compare favorably to either historical or forecasted growth (PEG).
Growth (G)
The foundation of growth investing is the notion that stocks of companies exhibiting strong, consistent and prolonged growth outperform those of slower-growth companies. Growth has several dimensions, including year-over-year increases in sales and earnings, long(er)-term historical sales and earnings growth rates and analyst-forecasted long-term earnings growth.
Stock screening methodologies are tagged as “growth” if they look for stocks with a history of earnings increases; look for minimum levels of growth in sales, earnings, cash flow, etc.; or have minimum projected earnings growth.
Momentum (M)
The momentum factor refers to the tendency of winning stocks to continue performing well in the near term (three to 12 months). Academics first identified the momentum premium in 1993, when Narasimhan Jegadeesh and Sheridan Titman demonstrated that the strategy of buying stocks that have done well and selling stocks that have done poorly generated significant positive returns over three- to 12-month holding periods.
Stock screening strategies are tagged as “momentum” if they look for minimum levels of absolute or relative price strength or require the share price to be within a certain percentage of the 52-week high.
Size (S)
The size factor captures the tendency of small-cap stocks to outperform bigger companies over the long run. The market capitalization of a company is its current share price multiplied by the number of outstanding shares. University of Chicago Ph.D. Rolf Banz identified the size factor in U.S. stocks in 1981. The research on size took off after economists Eugene Fama and Kenneth French included it as a key component in their influential three-factor model.
Stock screening approaches are tagged as “size” if they look for smaller companies, typically with market capitalizations below $2 billion, or relatively small levels of annual sales.
Earnings Estimates (EE)
Investing based on analyst estimates looks for revisions in the consensus estimates as well as earnings surprises (actual earnings deviating from the consensus estimate). Academic studies have shown that companies that have seen strong upward earnings revisions or have reported significant earnings surprises can see an impact on share prices for up to a year.
Screening strategies are tagged as “earnings estimates” if they filter for the number of upward or downward revisions by analysts; the percentage change in the consensus estimate; and the percentage by which reported earnings exceeds or falls short of the consensus estimate (percentage surprise).
Yield (Y)
A yield (or high dividend yield) investment strategy gains exposure to companies that appear undervalued and have demonstrated safe, stable and increasing dividends. Dividend investing is as old as stocks themselves, playing a central role in the evolution of corporations over the centuries. Groundbreaking economists Benjamin Graham and David Dodd famously called dividend payouts “the prime purpose of a business corporation … A successful company is one that can pay dividends regularly and presumably increase the rate as time goes on.”
Screening strategies are tagged as “yield” if they specifically look for dividend-paying stocks as well as minimum absolute dividend yields or stocks that are trading with yields above historical averages or sector/industry norms.
Quality (Q)
The quality factor is described in academic literature as capturing companies with durable business models and sustainable competitive advantages. This definition has been expanded to look at company profitability and growth and quality of management. The quality factor has helped explain the movement of stocks that have low leverage, stable earnings and high profitability.
Screening methodologies that are tagged “quality” look for companies with records of consistent sales or earnings growth; strong returns on equity on either an absolute basis or relative to historical averages or sector/industry norms; and reasonable levels of debt.
Industry/Sector (I)
Sector and industry rotation is an investment strategy involving the movement of money from one industry or sector to another in an attempt to beat the market.
Screening strategies tagged as “industry/sector” explicitly isolate specific sectors or industries.
Other (O)
The miscellaneous category captures specialty screening strategies that do not fall into one of the other factor categories.

Related

AAII Stock Ideas
Constructing Winning Stock Screens
Related
Investing Gurus
The Revised Foolish 8 Screen: Not-So-Foolish Results
Discussion
FREE REPORT

Get your free copy of our special
report analyzing the tech stocks
most likely to outperform the
market.
RICHARD P from CA posted over 5 years ago:
JOHN D from CA posted over 5 years ago:
JAMES M from MT posted over 5 years ago:
DAVE G from WA posted over 5 years ago:
PAUL K from CO posted over 5 years ago:
You need to log in as a registered AAII user before commenting.
Log InCreate an account