

Related

Retired Investor
A look at the trade-offs in retirement using two popular withdrawal strategies if you build a more aggressive or more conservative portfolio.

How much we withdraw (either by choice or by law) from our retirement portfolio each year is obviously influenced by the asset allocation of our portfolio—but how much, really? And what are the trade-offs if we build a more aggressive or a more conservative retirement portfolio?
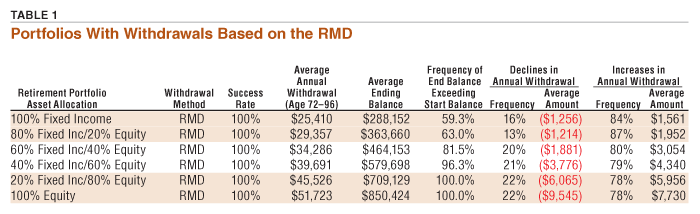
Shown in Table 1 are the results of retirement portfolio analysis over 27 rolling 25-year periods from 1970–2020 under the assumption that annual withdrawals were determined by the required minimum distribution (RMD). Each 25-year period represents a retiree from age 72 to 96. Studying so many rolling 25-year periods allows us to capture the impact of various return sequences on the retirement portfolio success rate (where “success” is defined as the portfolio staying solvent for at least 25 years of withdrawals), the average annual withdrawal and the average ending balance. In addition, we can examine how often the annual withdrawal declined from year to year and by how much (on average).
The starting point of the retirement portfolio analysis in Table 1 is a 100% fixed-income portfolio (80% in U.S. bonds and 20% in cash) and a starting balance of $250,000. We also assume the retiree is 72 years old, which coincides with the onset of the RMD. The success rate was 100%, meaning the portfolio had a positive balance after 25 years of withdrawals (over each of the 27 rolling 25-year periods). The average annual withdrawal in a 100% fixed-income portfolio was $25,410 and the average ending balance after 25 years was $288,152. Clearly, some 25-year periods produced higher and lower average annual withdrawals as well as higher and lower portfolio ending balances. The table reports the average results over 27 rolling periods of 25 years.
All of the results assume that the various multi-asset portfolios were rebalanced annually. See the box below for a summary of analysis specifications used for all portfolios.

As a reminder, the starting RMD withdrawal percentage at age 72 is 3.906% and then annually escalates to 12.346% by the age of 96 (and continues to escalate annually until it tops out at 52.63% at age 115). Thus, to have money left over after 25 years of RMD withdrawals is very encouraging. Even better, the average ending balance was higher than the starting balance!
Assuming a 100% fixed-income portfolio, we observe that the annual withdrawal (based on the RMD schedule) decreased in size from one year to the next just 16% of the time by an average of $1,256. Considering that the average withdrawal was over $25,000, an average annual decline of just over $1,200 is not as significant as it may first appear. Importantly, the annual withdrawal increased 84% of the time (from one year to the next) by an average of $1,561. In short, the average annual withdrawal increased year to year far more often and by a larger amount than it declined.
What happens if we build progressively more aggressive retirement portfolios—and what are the risks?
First off, the risk that we probably think of first is portfolio failure. But that will never be the case because the RMD-based annual withdrawal is based on a percentage of the portfolio’s ending balance each year. When only withdrawing a percentage of the portfolio’s value, it is not possible to completely liquidate the portfolio because after bad years (like 2008) the next year’s annual withdrawal will be smaller than the prior year—precisely because the portfolio’s value declined. This is a self-protecting mechanism built into a percentage-based withdrawal system.
Thus, it’s not the annual RMD withdrawals that will cause the failure of a retirement portfolio but rather an asset allocation (i.e., portfolio design) that produces large losses in the portfolio—for example, a retirement portfolio invested solely in bitcoin. Understandably, that is not a likely asset allocation for a retiree, but you get the point. The primary risk in a portfolio experiencing RMD-based withdrawals is that the annual withdrawal may decline the following year.
The first step toward a more aggressive portfolio is a 20% allocation to equity (10% allocation to large-cap U.S. stock, 5% allocation to small-cap U.S. stock and 5% allocation to non-U.S. stock) with 80% in fixed income (60% in bonds and 20% in cash). Migrating to a slightly more aggressive asset allocation increased the average annual RMD withdrawal to $29,357—an increase of roughly $4,000 annually, or $333 more per month. The average ending balance 25 years later rose to $363,660—an increase of approximately $75,000 from the all fixed-income portfolio. In an intriguing twist, the annual withdrawal declined each following year only 13% of the time by an average of $1,214. Both of these are improvements compared to a 100% fixed-income retirement portfolio. Thus, a little dash of equity reduced the risk of withdrawing less money the next year.
Understandably, we may want to minimize the RMD withdrawals because we are being forced to withdraw the money—and we don’t like being forced. I get that. But, in this analysis, I am assuming that we have two primary (and competing) goals for our retirement portfolio: 1) to maximize the annual income it provides in retirement, and 2) to maximize the growth of the portfolio over time. Thus, even if the RMD is the controlling factor determining the withdrawals, these two goals are still present.
Next, we transition to a 40% equity, 60% fixed-income portfolio. The average annual withdrawal increased by roughly $5,000 and the average ending balance grew by roughly $100,000 to over $460,000—or nearly double the starting value. The “risk” associated with this asset allocation is that each next year’s annual withdrawal declined 20% of the time over the 25-year withdrawal period—but only by an average of $1,881. Is that really a risk? I would suggest it’s not a material risk.
Finally, we fast forward to a 100% equity retirement portfolio (50% large U.S. stock, 25% small U.S. stock and 25% non-U.S. stock). It produced an average RMD withdrawal of $51,723—or roughly double the average of a 100% fixed-income portfolio. The average ending portfolio balance, however, increased by nearly three times. The risk is that the annual withdrawal declined 22% of the time by an average of $9,545.
We have now quantified the impact of moving from all fixed income to all equity in a retirement portfolio. The average annual withdrawal doubles, the average ending account balance after 25 years nearly triples, the risk of the annual withdrawal declining from year to year goes from 16% to 22%, and the average size of the annual decline goes from $1,256 to $9,545. On the other hand, the annual withdrawals increase the following year from between 78% to 87% of the time, regardless of portfolio’s asset allocation.
Lest we miss it, a very intriguing result is nestled in the middle column of Table 1—the percentage of time the retirement portfolio had a higher balance than the starting balance after 25 years of RMD withdrawals. The 100% fixed-income portfolio was “above water” after 25 years of withdrawals 59.3% of the time, whereas the 40% fixed income/60% equity portfolio finished with more money 96.3% of the time. Clearly, if a retiree only withdraws the RMD (and no more) AND has a portfolio with at least a 60% equity allocation, it is extremely likely that their portfolio will actually grow over time (assuming they rebalance the portfolio annually).
One final note about the results in Table 1. The figures in the table assume a starting balance of $250,000 at age 72. If you would like to assume a starting balance of $500,000 simply multiply the dollar-based results in the table by two. The percentage-based results will stay the same no matter what starting balance you assume. If you want to assume a starting balance of $1 million, multiply the dollar-based results in the table by four, and so on.
We think you’d like this related webinar! The Individual Investor Show: Virtue Stocks, Asset Allocation in Retirement and Investing in Young
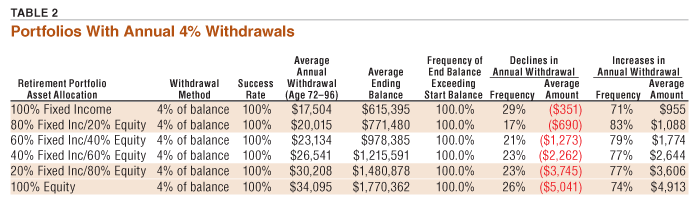
What if the RMD is not governing the annual withdrawals? For example, you may have some of your retirement money in a Roth IRA where the RMD is not applicable. Table 2 provides the same gauntlet of analysis but instead of assuming that the annual withdrawals are determined by the RMD, we will assume that 4% of the portfolio’s year-end balance is withdrawn annually. (This withdrawal rate was not adjusted upward for inflation.)
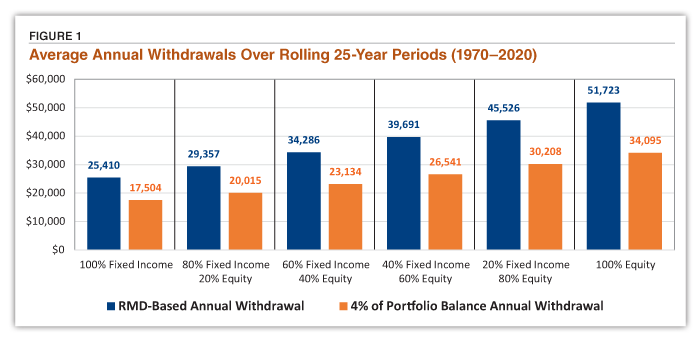
Several key differences stand out between RMD-based withdrawals and a 4% annual withdrawal rate. First, the average annual withdrawal is considerably smaller under the assumption of a 4% annual withdrawal. Of course, this should not be surprising. The first RMD at age 72 is 3.906% of the portfolio’s balance and then increases annually to 12.346% by the age of 96 (under current IRS guidelines).
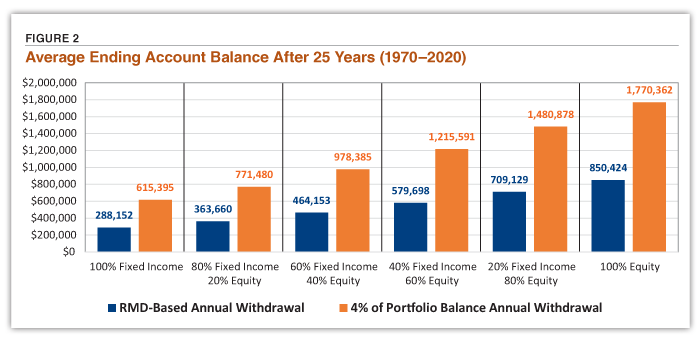
Second, the average ending balance (across all the asset allocations) is larger under a 4% withdrawal rate. Again, not surprising. If less is withdrawn, the ending balance will be larger. Third, regardless of asset allocation, when withdrawing 4% of the portfolio’s ending balance each year the portfolio’s account balance is larger after 25 years of withdrawals in every case. By comparison, the 80% fixed-income/20% equity portfolio had an ending balance that was larger than the starting balance only 63% of the time if we assumed RMD-based annual withdrawals.
Fourth, the average annual withdrawal over the rolling 25-year periods doubles if we move from a 100% fixed-income portfolio to a 100% equity portfolio. I am emphasizing this finding because it may be counterintuitive. Some might assume that moving from all bonds and cash to an all-equity portfolio would produce a larger impact on the average annual withdrawal. That is not the case.
Based on the performance of five key asset classes over the past half century, the survival of a retirement portfolio is virtually guaranteed for at least 25 years if you have a reasonable asset allocation and never withdraw more than 4% each year—or even if withdrawing the RMD amount each year. The 100% fixed-income model and 100% equity model in Tables 1 and 2 are not suggested as “reasonable” retirement portfolios. Those two models simply represent “bookends” for the analysis presented here.
Moreover, it is highly likely that a “reasonable” retirement portfolio will have a balance higher than your starting balance well into your 90s assuming a modest withdrawal rate of 4% annually. These results are based on the returns of the five core indexes (see Assumptions box below) over the past 51 years (from 1970–2020).
Starting balance: $250,000
Age at first withdrawal: 72
Success rate: positive portfolio balance after 25 years of withdrawals
Portfolios rebalanced: annually
Test period range: 27 rolling 25-year periods from 1970–2020
Lower-return portfolios: historical index returns for each calendar year from 1970 through 2020 reduced by 50%
Asset Allocation Breakdown
100% Fixed Income = 80% bonds, 20% cash
80% Fixed/20% Equity = 60% bonds, 20% cash; 10% large stock, 5% small stock, 5% non-U.S. stock
60% Fixed/40% Equity = 45% bonds, 15% cash; 20% large stock, 10% small stock, 10% non-U.S. stock
40% Fixed/60% Equity = 30% bonds, 10% cash; 30% large stock, 15% small stock, 15% non-U.S. stock
20% Fixed/80% Equity = 15% bonds, 5% cash; 40% large stock, 20% small stock, 20% non-U.S. stock
100% Equity = 50% large stock, 25% small stock, 25% non-U.S. stock
Indexes Used for Asset Class Performance
S&P 500 index
Russell 2000 index
MSCI EAFE index
Barclay’s Capital Aggregate Bond index
Three-month U.S. Treasury bills
A comparison of the average annual withdrawal between an RMD-based annual withdrawal versus a 4% of portfolio balance annual withdrawal is demonstrated in Figure 1. Figure 2 illustrates the difference in ending account balance after 25 years between RMD and 4% withdrawals.
What if the performance is much lower for U.S. stocks, non-U.S. stocks, U.S. bonds and cash over the next 10 to 20 years? The outcomes will clearly be less impressive. What would the results look like?
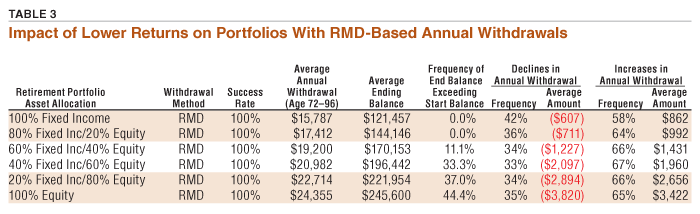
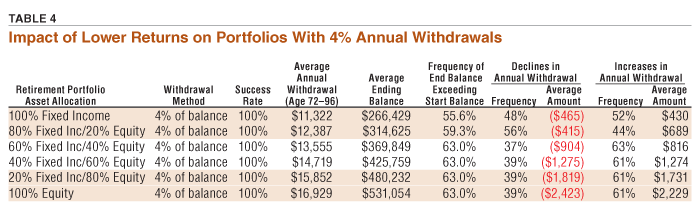
To examine this scenario, I reduced the historical returns of the five indexes by 50% and reran the analysis. For example, the 51-year return for the S&P 500 index from 1970–2020 was 10.75%. To simulate a bleak future, I cut each of the S&P 500’s calendar-year returns in half so that the 51-year average annualized return was now 5.34%. This same 50% reduction was applied to small U.S. stock, non-U.S. stock, U.S. bonds and cash. The RMD-based results are shown in Table 3 and the 4% withdrawal results are in Table 4.
If future returns are half as good as they were in the past (1970–2020), a retirement portfolio experiencing RMD withdrawals for 25 years will have stayed intact for 25 years—period. If we assume a 40% fixed-income/60% equity asset allocation, the average ending balance after 25 years of withdrawals will be higher than the starting balance roughly one-third of the time. The year-to-year annual withdrawals will be smaller about one-third of the time.
If the annual withdrawal is 4% of the portfolio’s value each year, the ending balance after 25 years of withdrawals will be higher than the starting balance roughly 63% of the time (assuming a 40% fixed-income/60% equity asset allocation). The success rate will be 100%—meaning the portfolio will not fail during the 25-year withdrawal period.
Retired Investor

Portfolio Strategies
Portfolio Strategies

J M from NJ posted over 5 years ago:
SCOTT Z from VA posted over 5 years ago:
PHILIP C from NC posted over 5 years ago:
Craig I from UT posted over 5 years ago:
TIMOTHY B from WA posted over 5 years ago:
J M from MD posted over 5 years ago:
CHRIS S from OR posted over 5 years ago:
David H from ME posted over 5 years ago:
ROBERT A from NC posted over 5 years ago:
MICHAEL M from VA posted over 5 years ago:
H from FL posted over 5 years ago:
STEVE O from FL posted over 5 years ago:
VINCENT P from NY posted over 4 years ago:
S G from PA posted over 4 years ago:
ROBERT A from NC posted over 4 years ago:
H from FL posted over 4 years ago:
You need to log in as a registered AAII user before commenting.
Log InCreate an account