


Related

Financial Planning
Knowing what to look for in the annual report and shareholder letter will help you stack the odds in your favor.
by John Deysher | June 2021

We’ve often said that an annual report is like a chapter in a public company’s life—a yearly update on what happened last year and the outlook for the future. Reading an annual report is often a labor of love for many investors. Too often the report ends up in the circular file after only a perfunctory glance. This is too bad since the annual report often provides insights on where a company’s coming from and clues on where it’s going. Even if you’re not a financial expert, annual reports are well worth reading at any time of the year especially if you have an ownership position or are considering initiating a position.
While the financial statements within an annual report are critical, the non-financial information is just as important. Your goal is to assess how the company is doing in terms of growth, profitability, any existing or potential problems, risks, adequacy of financial resources and other factors. While the numbers tell part of the story, you can tell a lot about the future prospects by reading the text, which explains the nuances and circumstances surrounding the numbers. Treat the annual report as a yearly report card.
One of the first things I notice when opening an annual report is whether the firm spent a lot of money producing it. Lots of glossy pictures filled with photos, meaningless graphics or empty space (instead of text) is a red flag. An annual report is not a marketing piece or promotion document. It’s a candid assessment of how well or poorly the firm did.
Too many pictures of the CEO are also a red flag. Often this indicates a CEO with an ego that could easily rankle the team members, the backbone of the entire company. The best picture of a CEO should be as part of a group shot with the key managers.
It’s a good sign if the annual report is all text, financial statements and notes (à la Berkshire Hathaway) and uses every square inch of space efficiently, including the inside of the front and back covers. The firm’s address and phone number should also be displayed should you wish to contact them.
What do we look for in a CEO’s shareholder letter? First and foremost, the letter should provide a candid and honest appraisal of past results—what were the successes, challenges and surprises? At a minimum, the letter should state what sales and earnings were and how they compared with last year, and it should provide an explanation of operating results. It should also provide commentary on the firm’s future prospects. Without too many details that might tip off competitors, the CEO should articulate a vision of where the company is going, how it intends to get there and what the opportunities might be.
One of our fundamental questions is “How did the company do?” If we read through the entire letter and any accompanying tables with no clue on results, it’s normally a sign the company didn’t do so well. We’ve found that strong CEOs write quality annual letters, while weak CEOs write mediocre letters. We’re not saying that a strong CEO won’t have a disappointing year, but coming clean speaks volumes about a CEO’s character.
For a good example of a well-written shareholder letter, take a look at the Ennis Inc.  (EBF) annual report (see the box below). CEO Keith Walters writes it himself and takes pride in bringing shareholders up to date. His most recent letter was five pages and highlighted past results, balance sheet strength, mergers & acquisitions (M&A) strategy, capital allocation and future outlook.
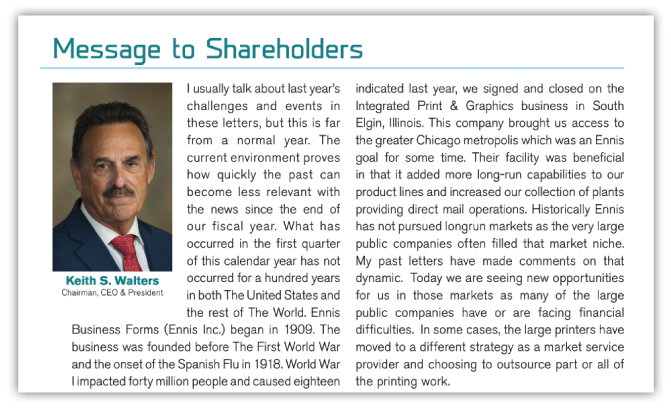
Ennis Inc.’s (EBF) CEO Keith Walters takes pride in bringing shareholders up to date. The message to shareholders contains little in terms of graphics and glossy pictures, focusing instead on the company’s operations and its results. It is an example of a report created to keep shareholders informed on the latest developments and the company’s strategy as opposed to a marketing document.
The report can be found at: www.ennis.com/about/investor-relations/annual-reports.
We’re always surprised when a CEO highlights a rising share price, often in the first paragraph or two. While a rising share price is always welcome news, the letter is not the proper place to highlight this unless the CEO plans to highlight a declining share price when things don’t go well. Too much talk about the share price rather than business fundamentals indicates misplaced priorities. You want a CEO who is running the business, making money for shareholders and maintaining a strong balance sheet, not one who is focused on the share price.
Every management team makes mistakes, some fewer than others (we try to identify these). We appreciate managers who tell it like it is and own up to mistakes, tell us what they learned and what changes were made to prevent similar missteps from happening again. While some issues are beyond control—like the impact of the coronavirus pandemic, we like CEOs who address issues they can control such as sales initiatives, cost control efforts, key new hires, capital allocation decisions and M&A efforts.
If a CEO complains about policies or actions of the president, Congress or state or local governments, beware. Of course, government mandates can impact results—tariffs and pandemic responses are two recent examples. The letter should address the consequences but leave the political rants out—potential customers may not share their same view.
A CEO should always address write-offs, one-time expenses, changes in tax or depreciation rates and other items that may significantly impact earnings. Were there any major changes to the balance sheet? Any meaningful increase in financial leverage or higher debt should be explained. If the CEO highlights growing cash flow, does that reflect any capital expenditures (capex)? We’ve seen situations where operating cash flow is up, but net cash flow is down due to higher capex. Or perhaps cash balances are up due to debt issuance (we always focus on net debt).
Are indications of future growth achievable and reasonable? Does management understand the company’s place within the industry and what changes are impacting it? For example, with online retail sales growing, we’d be wary of a CEO who plans to open many more physical stores, especially in existing markets.
Often the CEO will highlight a firm’s charitable donations, including sponsorships of various community events. Most investors support corporate giving if it is not excessive and if it aligns with a firm’s mission and enhances the brand. But significant donations to unrelated causes are a waste of shareholder capital.

Here are examples of three warning signs; however, they are not the only things to look for.
The presentation of the annual report: Lots of glossy pictures and graphics suggest the report is being used as a marketing tool as opposed to a candid assessment of how the company is doing.
Too much focus on the stock price: CEOs should use a shareholder’s letter to focus on the business and explain their vision and strategy, not a rising share price.
Problem identified by the auditors: These can include, but are not limited to, unresolved lawsuits, going concern questions, qualified opinions and statements including the phrase “except for.”
Located close to the CEO’s letter is usually a table showing the financial highlights for the last three to five years. Take a look at the numbers and notice where they’re headed.
How are sales and earnings trending? Sales may be increasing but earnings may be rising less quickly or even decreasing, signaling margin compression. Conversely, sales may be declining but earnings may be rising, a sign that the firm is pruning away low margin business. Ideally, sales and earnings should both be rising, with earnings rising faster than sales as the firm leverages its infrastructure.
Keep an eye on the shares outstanding. Sometimes earnings are increasing but earnings per share (EPS) are growing at a slower rate. This occurs when the shares outstanding used to calculate earnings per share are rising faster than earnings, a phenomenon known as “dilution.” Some common reasons for a rising share base include public stock offerings, exercise of stock options and the issuance of shares used to fund an acquisition.
Equity capital is precious, and management should strive to keep share issuance to a minimum. While I’m willing to accept some short-term dilution with the issuance of new shares, the goal is earnings per share “accretion” with earnings rising faster than shares outstanding.
Normally shown close to earnings per share is dividends per share. Dividends received plus share price appreciation determine the total return of your investment. If dividends are rising faster than earnings per share, the “payout rate” is rising. This may indicate that growth opportunities are slowing and the firm believes that excess earnings should be distributed to shareholders. If earnings per share are growing faster than dividends per share, growth prospects are still good, and shareholders will be better served by reinvesting in the business to generate higher earnings per share and share price. Remember that dividends are taxed twice, once at the corporate level and again at the shareholder level. Unless you need dividend income, capturing realized long-term capital gains from the sale at a higher share price is usually more tax-efficient. The tax treatment of long-term gains may change in the future.
Important balance sheet items are also disclosed in the selected financial data section. The balance sheet provides a snapshot of the firm’s financial position at a single point in time.
Total assets are everything a company owns. Those that can be converted to cash within a year are current assets.
Total liabilities are everything a company owes. Current liabilities are those that come due within a year.
Working capital is current assets less current liabilities. It’s a measure of liquidity and a key figure to watch year to year.
Net working capital is a term often used to describe current assets minus total liabilities. This indicates a very liquid balance sheet since a firm can satisfy all liabilities with current assets. Sometimes during market disruptions, net working capital per share exceeds the share price—a rare event. Stocks trading below net working capital per share don’t stay that way for long and are soon bid up.
Shareholder’s equity is total assets less total liabilities. It’s the dollar value of what shareholders own after satisfying all liabilities. Book value per share is shareholder’s equity divided by shares outstanding; normally you want this to grow over time.
Another important number to watch is net debt, defined as short-term plus long-term debt less cash and marketable securities. Currently, many firms are taking advantage of ultra-low interest rates to issue low-cost debt. This is normally not an issue provided that debt to total capital (debt plus equity) remains at a reasonable level. It’s also important that the debt be structured so that debt service costs are reasonable. Many energy companies ran into problems when falling revenues limited their ability to make timely interest and principal payments. Better to have debt maturities properly staggered over time.
The last key section of the selected financial data table is the profitability measure. This is often portrayed as return on equity (ROE), which divides net income by average shareholder equity. Generally, the higher the ROE the better, but beware of a company that generates a high ROE by using debt that is excluded from the denominator.
A better measure of profitability is return on capital (ROC) which includes equity plus net debt (including convertibles) in the denominator. This provides a more complete picture of profitability since it includes all parts of the capital structure, not just equity.
Some firms may use cash flow instead of net income as the numerator. This is acceptable as long as net cash flow is used, defined as cash flow from operations less any net capex. Like many, we believe that capex is an important cost of doing business and should always be reflected in calculating net cash flow.
The management discussion & analysis (MD&A) section is the guts of the annual report and includes several key sections.
Management will discuss how the company did for the last two to three years in detail—changes in sales, earnings, margins, tax rates, etc. Also discussed in this section will be the impact of significant events, including acquisitions and divestitures, product or distribution channel additions, the loss or gain of key customers, litigation and changes in raw material costs. Read this section slowly since there is a lot here that needs to be absorbed.
This section is always worth reading since management is telling us what could go wrong. Often, there are multiple sections including, for example, risks related to the business, risks related to the industry and risks related to a specific security. The more granularity provided the better.
We always try to compare this section of the annual report with previous annual reports to assess what new risks have been added and which have been eliminated. It’s always worth noting what new risks have been added—if the lawyers feel a risk is worth disclosing, it’s usually important and worth paying attention to.
Generally, this section addresses the capital structure and any changes to it—for example, a stock or debt offering. There are usually tables showing projected debt repayments, lease payments and pension obligations. Take note of debt maturities and credit line expirations—ideally there should not be chunks of debt coming due at the same time. Consider whether the debt is mostly fixed rate or variable rate. The latter may leave the firm exposed to interest rates. Look for any debt amendments or forbearances such as maturity extensions or loosening of covenants that might signal trouble is brewing.
The notes contain lots of important issues you should be aware of including:
Most firms with publicly traded securities will use national or regional audit firms. A change in auditors is acceptable as long as it doesn’t happen too often and is not the result of an accounting dispute. In reviewing the audit report, look for a “qualified opinion” and the reasons the auditor gives for it. Make sure that the financial statements present fairly the financial position and operations of the firm in conformity with U.S. generally accepted accounting principles (GAAP).
Watch out for the following:
Take your time reading the auditor’s report and take note of any changes from last year.
These are some of the basics for measuring a company’s health by reading its annual report and shareholder letter. Over the years, companies have provided more and more disclosure in their reports, providing a greater education to the shareholder. Take advantage of this with a healthy combination of skepticism and optimism. With investing, you want to try to stack the odds in your favor. Knowing what to look for in the annual report and shareholder letter will help you on your way. Happy reading.
Financial Planning
Financial Statements

Stock Strategies

CAHILL T from IL posted over 5 years ago:
BLAINE W from WA posted over 5 years ago:
JON S from TX posted over 5 years ago:
Brigid A from IL posted over 4 years ago:
BARRY J from TX posted over 2 years ago:
You need to log in as a registered AAII user before commenting.
Log InCreate an account