

Related

Portfolio Strategies
An examination of various investing periods reveals the ones that come the closest to achieving returns seen in a 95-year period.
by Craig Israelsen | June 2021

Investing for the “long run” is a very compelling mantra—at least for those who have a long run ahead of them. For the investor who is currently 105 years old, this article may be somewhat less useful. If you’re younger than 80 years old—I think it will apply. The question is simply this: Just how long is the long run? Is it two years? Five years? 10 years? Or even longer?
In an attempt to shed some light on this, I will examine four asset classes (large-cap U.S. stocks, small-cap U.S. stocks, U.S. bonds and U.S. cash) over investment holding periods ranging from five years to 35 years in length. I will also examine a four-asset portfolio (consisting of 40% large-cap U.S. stocks, 20% small-cap U.S. stocks, 30% U.S. bonds and 10% U.S. cash). The overall time frame of this study is the 95-year period from January 1, 1926, to December 31, 2020.
The historical returns of four indexes were used in this analysis. Large-cap U.S. stocks were represented by the S&P 500 index from 1926–2020. Small-cap U.S. stocks were represented by the Ibbotson Small Stock index from 1926–1978 and the Russell 2000 index from 1979–2020. U.S. bonds were represented by the Ibbotson U.S. Intermediate Government Bond index from 1926–1975 and the Barclays Capital Aggregate Bond index from 1976–2020. Finally, U.S. cash was represented by 90-day Treasury bills from 1926–2020.
Does the past 95 years (from 1926–2020) represent a long run? In terms of performance data availability, it’s the longest span I have access to—so the answer is yes, 95 years represents a “long run.” For the purposes of this study, therefore, the 95-year period from 1926–2020 represents our benchmark long-run performance. With that established, we will examine investment periods that, while shorter than 95 years, might reasonably be considered long-run periods based on performance similar to the 95-year performance benchmark.
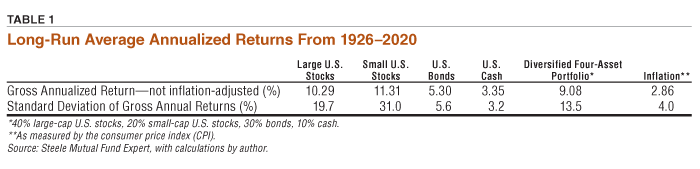
Shown in Table 1 are the gross (meaning not inflation-adjusted) average annualized returns for each individual asset class, a four-asset portfolio and the consumer price index (CPI) over the past 95 years. The four-asset portfolio was rebalanced annually. The impact of taxes was not considered.
Over the past 95 years, large-cap U.S. stocks have produced a 10.29% gross average annualized return, small-cap U.S. stocks averaged 11.31%, U.S. bonds averaged 5.30% and U.S. cash averaged 3.35%. The four-asset (40% large stock, 20% small stock, 30% bonds, 10% cash) portfolio produced a 95-year average annualized return of 9.08%. Not surprisingly, the 95-year standard deviation of annual returns is dramatically smaller for U.S. bonds and U.S. cash compared to U.S. large stocks and U.S. small stocks. It is encouraging to observe that a diversified portfolio achieved 88% of the return of large-cap U.S. stocks—but with 31% lower standard deviation (hence, 31% less risk).
The impact of inflation on asset class returns can be significant. Over this 95-year period, the inflation-adjusted (or “real”) return of large-cap U.S. stocks was 7.22%. Small stocks had an inflation-adjusted return of 8.24%, bonds delivered an annualized return of 2.38% after inflation and U.S. cash eked out a 0.49% 95-year average annualized real return. The four-asset portfolio generated a real annualized return of 6.06% between 1926 and 2020.
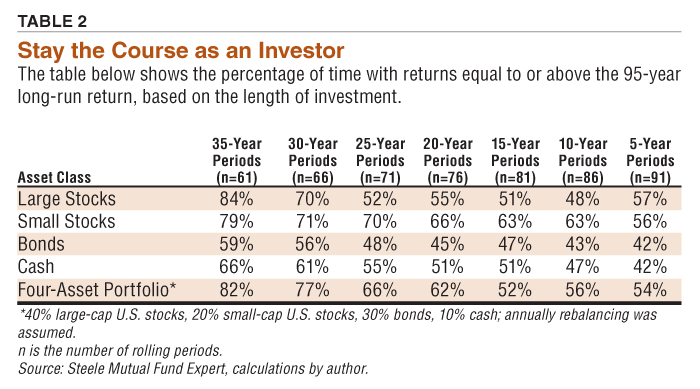
On to the main question: How long do we need to invest in a particular asset class (or portfolio of asset classes) to achieve or exceed the long-run 95-year return in each asset class? As shown in Table 2, a 100% large-cap U.S. stocks investment achieved an annualized return of 10.29% or higher in 84% of the rolling 35-year periods between 1926 and 2020, but in only 57% of the rolling five-year periods.
A sole investment in small U.S. stocks exceeded the long-run return of 11.31% in 79% of the 61 rolling 35-year periods compared to 56% of the time in the 91 rolling five-year periods. Bonds produced a return equal to or higher than 5.30% in 59% of the rolling 35-year periods, but in only 42% of the rolling five-year periods. Cash outperformed the long-run return of 3.35% in 66% of the rolling 35-year periods but only 42% of the rolling five-year periods. An annually rebalanced, four-asset portfolio produced a return of 9.08% or higher in 82% of the rolling 35-year periods and in 54% of the rolling five-year periods.
It is quite clear that longer holding periods produce returns that are closer to or higher than long-run performance. The long run for investing in large-cap U.S. stocks is at least 30 years (assuming that a 70% “success rate” of achieving a long-run return is used as the threshold) and 25 years for small-cap U.S. stocks. For bonds and cash, performance is somewhat better when the holding period is longer, but the impact is not nearly as dramatic as we observe when investing in stocks. The long run for a four-asset portfolio is 30 years and beyond. If only investing for 25 years, the four-asset portfolio achieved the long-run return of 9.08% only 66% of the time. If investing for at least 30 years, the four-asset portfolio produced a return of 9.08% or higher 77% of the time.
The next question is this: If the four-asset portfolio’s performance over a particular time period was below the long-run return, by how much did it underperform?
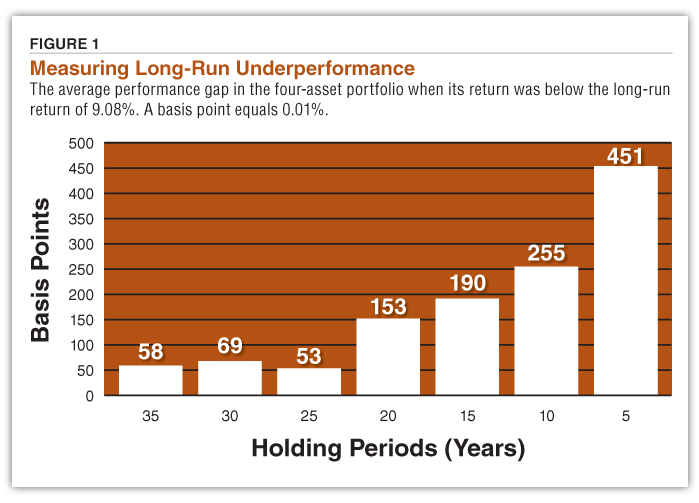
In Figure 1, we see the results for the four-asset portfolio. For instance, if investing for at least 35 years, we know from Table 1 that the four-asset portfolio achieved or bettered the long-run return of 9.08% in 82% of the 61 rolling 35-year periods from 1926–2020. But that also means the portfolio underperformed the long-run return of 9.08% in 18% of the 61 rolling 35-year periods. In fact, the average amount of underperformance was 58 basis points (0.58%). In other words, even when the four-asset portfolio did not achieve the long-run return over 35-year periods, it didn’t miss by much. Fifty-eight basis points is just slightly more than half of 1%. So, when the four-asset portfolio did not achieve a return of at least 9.08% over a 35-year period, its return was roughly 8.50% (or 58 basis points lower than the long-run return of 9.08%).
By contrast, over rolling five-year periods the average underperformance when the portfolio failed to achieve the long-run return of 9.08% was a whopping 451 basis points (4.51%). In other words, when only investing for a five-year period, the four-asset portfolio return was below the long-run return 46% of the time. The average amount of underperformance was 451 basis points (or a return of 4.57% on average).
We observe in Figure 1 that when a four-asset portfolio failed to achieve the long-run return over investment holding periods of 35 years, 30 years and 25 years, it missed by between 53 to 69 basis points (0.53% to 0.69%)—so, not a very big miss. Over a holding period of 20 years, however, the four-asset portfolio had an average miss of 153 basis points—or roughly 1.5 percentage points. Thus, when we are not able (or unwilling) to invest in a primarily equity-based portfolio for at least 25 years, we are more likely to fall short of a long-run return both in terms of frequency and magnitude. With this additional insight about the “average amount of the underperformance,” we can now say that a 25-year investing period for a multi-asset portfolio is long enough to achieve—or be very close to—the long-run return.
The general findings from this analysis are crystal clear: Based on the past 95 years, the longer the investing time frame, the more likely we are to achieve a return that is closer to the long-run return when investing in stocks or a portfolio that includes at least a 60% allocation to stocks. Said slightly differently, investing in a diversified portfolio that has roughly a 60% exposure to stocks for longer time periods does not guarantee that the performance will meet or exceed the long-run return—but it dramatically increases the likelihood of achieving performance that is closer to the long-run return.
Now, a metaphor: True long-run investing is akin to cooking with a crockpot—not a microwave. This will likely come as a real shocker to some investors today whose “microwave” mindset may lead them to believe that a 14-month investment period is a long-term hold. It’s not.
If, however, a portfolio is composed primarily of bonds and cash, we take some comfort in observing that a long investment period is not as crucial in achieving a return that is reasonably close to the long-run return. For this reason, these two asset classes (particularly cash) are viewed as safer short-term investments compared to the dramatic performance volatility that we observe in stock-based investments. That said, the future for bonds right now is certainly bleaker than it was in the early 1980s.
So, just how long is the long run? Based on these findings, for stock and stock-based portfolios a long-run investment period is at least 25–30 years in length. Translation: Young to middle age investors might want to plant a hardwood tree the same year they start investing. When the oak tree is about 35–40 feet tall—which should take roughly 25–30 years—the portfolio will very likely have achieved a long-run return.
Portfolio Strategies

Portfolio Strategies

Portfolio Strategies

PETER V from WA posted over 5 years ago:
Craig I from UT posted over 5 years ago:
JAMES F from FL posted over 5 years ago:
BARRY J from TX posted over 5 years ago:
GARY K from TX posted over 5 years ago:
KENNETH B from ID posted over 5 years ago:
BUD S from WA posted over 5 years ago:
STEVE W from VT posted over 5 years ago:
You need to log in as a registered AAII user before commenting.
Log InCreate an account