


The A+ Stock Grades system is a grading tool based on percentile rankings of multiple key metrics within five investment factors: value, growth, momentum, earnings estimate revisions and quality. They summarize a company’s fundamentals and price on the five investment factors that have been shown to reflect future performance.
Since rolling out the grades system, we have continued to research improvements for how the system ranks stocks based on underlying characteristics associated with future returns. Last year, we revised the A+ Value Grade and the A+ Quality Grade. We backtested theoretical improvements for the period of 1998 through 2019. For both grades, results indicated correlated returns based on grades ranging from A (best 20%) through F (worst 20%). The improvements also broadened the range of stocks eligible for a grade.
Adding Estimated Growth to the A+ Growth Grade
Last fall, we began working on potential improvements for the A+ Growth Grade. The foundation of growth investing is the notion that stocks of companies exhibiting strong, consistent and prolonged growth outperform those of slower-growth companies. Growth has several dimensions, including year-over-year increases in sales and earnings, long(er)-term historical sales and earnings growth rates and analyst-forecasted long-term earnings growth estimates.
The components consider a company’s success in growing its sales, earnings per share and operating cash on a year-over-year basis for the latest reported fiscal quarter and on an annualized basis over the last five years.
One dimension missing among the Growth Grade’s components is a stock’s projected earnings growth rate. The base components are all historical. We wondered if the consensus earnings estimate growth rate was predictive of future stock prices.
Before adding the metric as a component, we backtested compound annual growth rates (CAGRs) using a stock’s most recent annual historical earnings per share (EPS) and its consensus annual earnings per share estimate.
Stocks were ranked by their growth rates, then split into groups based on their percentile ranking and assigned a corresponding grade of A through F. The top 20% of growth rates were assigned a grade of A, the next 20% were assigned a grade of B, etc.
We ran three versions of the compound growth component. We wanted to see if there was a trend in relative price returns based on how far forward analysts provide earnings estimates. The first version calculated CAGR between the most recently completed year’s annual earnings and the consensus earnings estimate for the next fiscal year (Year 1). The second version calculated CAGR between the most recently completed year’s annual earnings and the consensus annual earnings estimate for the fiscal year in two years (Year 2), if provided. The final version was a composite calculation of CAGR between the completed year’s annual earnings and the consensus annual earnings estimate for Year 2 or one year out if Year 2 estimates were not available.
- CAGR Hist. EPS Year 1 to Est. Year 1
- CAGR Hist. EPS Year 1 to Est. Year 2
- CAGR Hist. EPS Year 1 to Est. Year 1 or Year 2
We next measured the average one-year price return of each graded group of stocks, and then tracked their average cumulative performance between 1998 and 2019. Figure 1 shows graphs of the average annual returns and cumulative returns for these three tests.
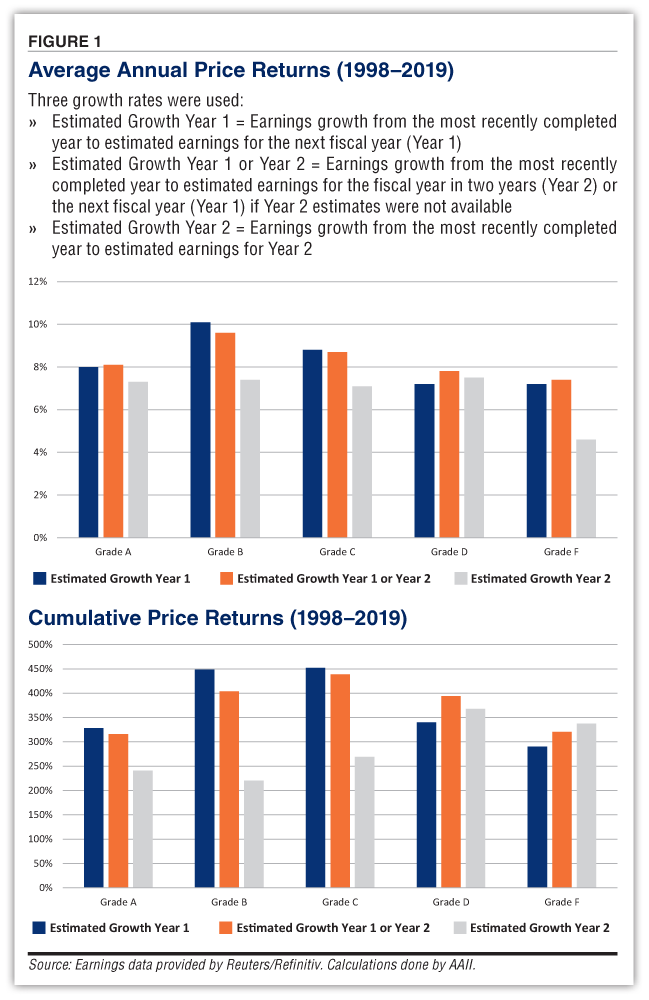
Highest Projected Growth Rates Failed to Deliver Highest Returns
According to our results, the best stock price performance did not come from the A-graded groups for any of the three CAGR formulas. B-graded and C-graded stocks had the best and second-best average annual return for the estimated Year 1 CAGR and the estimated composite CAGR.
This performance stratification was most prevalent in the tests for the estimated Year 1 CAGR and the estimated composite CAGR. This pattern appeared to a lesser extent with the estimated Year 2 CAGR.
In our results, stocks with moderate projected growth rates were better performers. C-graded stocks outperformed A-graded and B-graded stocks through cumulative price return, despite having lower average annualized growth.
Unfortunately, these results showed that the compound growth rate of historical annual earnings to projected annual earnings does not fit easily into the A+ Stock Grades system—the A grade ranking of stocks by this metric doesn’t correlate with A-grade historical performance.
One explanation of what the research captured is the trend of high-growth stocks to revert to the market’s average return. Mean reversion has historically occurred when market segments with abnormally high profitability attract competition, leading to an eventual decrease in profitability. Whether the periods of low profitability are cyclical or competition-based, when a company begins to miss quarterly financial estimates, its price will fall and stay low for a time.
There is also the issue of the number of analysts providing estimates to consider. Over the last 20 years, the number of stocks with published long-term (three- to five-year) earnings estimate growth rates from analysts has decreased considerably. This is making it more difficult to analyze stocks based on their projected long-term growth, as less coverage leads to more influence from an overly optimistic or pessimistic analyst.
Takeaways
Given these findings, we are not adding a component based on consensus estimate growth rates to the A+ Growth Grade at this time. The additional criteria we thought would work did not.
However, our research has still been fruitful in that we established a dataset and knowledge for future use in potentially refining the stock grades system or stock screens.
It also provides AAII members insights into the risks of relying on forecasted growth rates to analyze stocks.

Related

Related

Stock Strategies
Traits to Look for in Growth Stocks
Discussion
FREE REPORT

Get your free copy of our special
report analyzing the tech stocks
most likely to outperform the
market.
RICHARD S from TX posted over 5 years ago:
RICHARD S from TX posted over 5 years ago:
BOHDAN C from PA posted over 3 years ago:
You need to log in as a registered AAII user before commenting.
Log InCreate an account