


Charles Rotblut leads a class in AAII's new Essential Investing Video Course. Go to https://www.aaii.com/ves for more information and to subscribe.

Featured Tickers:
One of the arguments in favor of diversification is that it increases the odds of being allocated to the right asset class group at the right time.
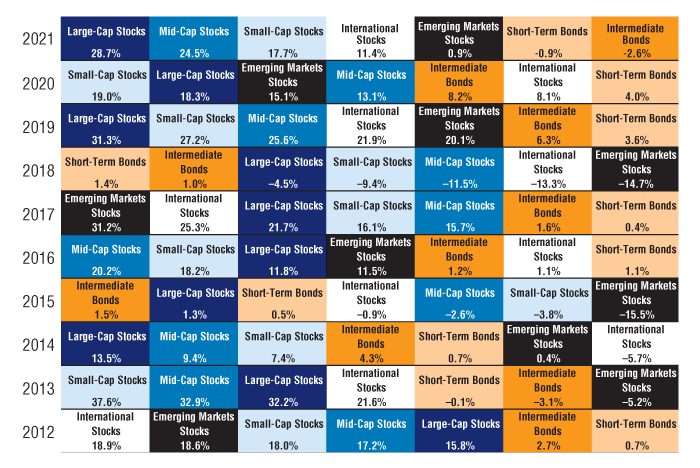
Last year, being allocated to large-cap stocks paid handsomely. Large-cap stocks delivered a 28.7% gain. This return bested the performance of the other asset class groups comprising the AAII Asset Allocation Models.
Intermediate-term bonds and short-term bonds fell in value last year, declining by 2.6% and 0.9%, respectively. This was not surprising given stronger inflation and expectations for the Federal Reserve to both end its bond buying program and raise interest rates.
Emerging markets stocks also had a rough year with just a 0.9% gain. A combination of the pandemic, high sovereign debt and the strong U.S. dollar all weighed on the performance of such stocks.
Figure 1 shows the returns for the asset class groups used in the AAII Asset Allocation models. This “heat map” ranks each asset class group by its calendar-year performance in descending order from left to right. The groups are color-coded so you can track their relative performance over time.
FIGURE 1. Annual Returns for Each Asset Class Group (2012–2021)
The figure below shows the annual returns for each of the asset class groups used in the AAII Asset Allocation Models. The asset class groups are sorted in descending order of return (left to right) for each calendar year. As you can see, the best-performing asset class frequently changed from year to year, demonstrating the benefits of diversification.
Prior to December 2020, the following mutual funds were used as proxies for calculating historical performance: Vanguard 500 Index Investor Class  (VFINX), BNY Melon Mid Cap Index Investor Class (PESPX), Vanguard Small Cap Index Investor Class (NAESX), Schwab International Index, Schwab International Index (SWISX) and Vanguard Emerging Markets, Stock Index Investor Class (VEIEX), Vanguard Intermediate-Term Treasury Investor Class (VFITX) and Vanguard Short-Term Treasury Investor Class (VFISX).
As of December 2020, the following funds are used to calculate historical performance: Vanguard 500 Index Admiral Shares (VFIAX), Vanguard Mid-Cap Index Fund Admiral Shares (VIMAX), Vanguard Small Cap Index Admiral Shares (VSMAX), Vanguard Developed Markets Index Fund Admiral Shares (VTMGX), Vanguard Emerging Markets Stock Index Admiral Shares (VEMAX), Vanguard Intermediate-Term Treasury Admiral Class (VSIGX) and Vanguard Short-Term Treasury Investor Shares (VFISX).
Source: Morningstar.
As you look at the chart, one thing should jump out—the lack of a consistent leader. While large-cap stocks have had a nice run over recent years, they have not always been the leader. Six different asset class groups have held the top spot over the past seven years: intermediate-term bonds (2015), mid-cap stocks (2016), emerging markets stocks (2017), short-term bonds (2018), large-cap stocks (2019 and 2021) and small-cap stocks (2020).
While there is always a temptation to make predictions, returns often end up being different than expectations. Diversification reduces the risk of being wrong by increasing the odds of being allocated to the right asset class group at the right time.
Keep in mind that your goals and tolerance for risk should drive your allocation decisions, not recent performance data or expectations of what will happen next. Stocks provide long-term growth of capital while bonds—particularly when held to maturity—provide preservation of capital.
Hear More on This Topic
Individual Investor Show: Improve Your Allocation by Gauging Risk and Ranking Asset Returns

Related

AAII InvestoGraphic
The Changes Made to AAII's Asset Allocation Models
Related

Discussion
FREE REPORT

Get your free copy of our special
report analyzing the tech stocks
most likely to outperform the
market.
JAMES H from MN posted over 4 years ago:
BARRY J from TX posted over 4 years ago:
Patricia C from TN posted over 4 years ago:
DAVID F from TX posted over 4 years ago:
You need to log in as a registered AAII user before commenting.
Log InCreate an account