



James O’Shaughnessy is well known for authoring books with his studies of the stock market that help to establish evidence-based rules investors can use to build and manage stock portfolios. We have formulated a number of stock screens based upon O’Shaughnessy’s research that are accessible on AAII.com for AAII members and built into AAII’s fundamental stock analysis and screening program Stock Investor Pro.
The O’Shaughnessy Small Cap Growth & Value screen was the top-performing approach during 2021, gaining 189.6%. The screen benefited from “meme stock mania” as it held GameStop Corp.  (GME) shares at the start of 2021. It is one of four stock screens inspired by O’Shaughnessy’s 2006 book “Predicting the Markets of Tomorrow: A Contrarian Investment Strategy for the Next Twenty Years.”
Through an examination of stock market history, O’Shaughnessy developed four stock selection approaches for individual investors. He focuses on finding stocks within various market capitalization segments that are most likely to do well based on his research—large-cap growth market leaders, small-cap growth and value, micro-cap tiny titans and an all-cap approach.
O’Shaughnessy studied data dating back to the late 1790s and found that equity markets tend to move in cycles of about 20 years. He indicated that there was a trend beginning in early 2000, during which time investors would earn greater returns with small- and mid-cap stocks and large-cap value stocks. The previous 20-year cycle favored large-cap growth stocks, while small- and mid-cap stocks and large-cap value stocks were, on average, underperforming the market.
What It Takes: O’Shaughnessy Small Cap Growth & Value Criteria
- Market cap between $200 million and $2 billion
- Stock must be exchange listed
- Company must be headquartered in the U.S.
- Price-to-sales ratio less than 1.50
- Trailing 12-month earnings per share greater than the prior 12-month period
- 13-week relative price strength index greater than the average for all companies
- 26-week relative price strength index greater than the average for all companies
- Stocks satisfying the criteria above are then ranked by the 52-week relative strength index and the 25 stocks with strongest figures pass the screen.
Screen Performance
We first presented the O’Shaughnessy Small Cap Growth & Value screen in the August 2006 AAII Journal. We backtested the approach going back to 1998 with a monthly rebalancing cycle to provide performance information prior to 2006.
As Figure 1 shows, the O’Shaughnessy Small Cap Growth & Value approach has outperformed the S&P 500 index since inception (the beginning of 1998). The approach has also outperformed the S&P SmallCap 600 index over the same time period. The screen has generated a compound annual price gain of 19.9% over the period from January 1998 through January 2022, while the S&P 500 is up 6.6% annually over the same period.
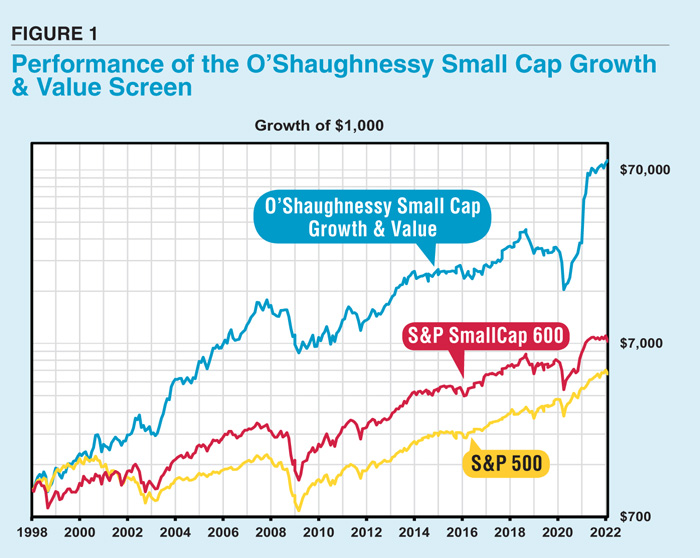

As we have seen with small-cap approaches, the strong long-term performance has been accompanied by a great deal of variability from year to year. The annualized standard deviation of the O’Shaughnessy Small Cap Growth & Value approach is 28.8%, while the S&P 500’s standard deviation is 15.2% over the same period. The O’Shaughnessy approach has had positive calendar-year returns 79% over the last 24 years and has outperformed the S&P 500 71% of the last 24 calendar years. The screen’s strongest year was in 2021 when it gained 189.6%, and its worst year came in 2008 when the approach lost 32.4%. By way of comparison, the S&P 500 was up 26.9% during 2021 and lost 38.5% during 2008.
As an AAII member, you can follow the O’Shaughnessy Small Cap Growth & Value strategy’s performance and see how it compares to the other stock approaches that AAII tracks at the Screening area of AAII.com (choose Guru Screens from the dashboard). You can also see a monthly list of the stocks passing the screen.
Investing Using the O’Shaughnessy Small Cap Growth & Value Screening Model
O’Shaughnessy’s Small Cap Growth & Value screen focuses on small-cap stocks with upward price momentum using both growth and value criteria. The screen seeks to find “cheap stocks on the mend.”
Market Capitalization
The first criteria eliminate micro- and large-cap stocks by limiting the current market cap of passing companies to between $200 million and $2 billion. O’Shaughnessy adjusted these criteria limits for inflation using the long-term average rate of 3% per year. Adjusting for inflation is not only important for calculating portfolio returns. By adjusting the market caps when backtesting and going forward, you are better able to maintain a database of desired cap-size stocks regardless of inflation’s effect on asset size. The screen also excludes foreign companies and stocks that are not listed on exchanges.
Price-to-Sales Ratio
A low price-to-sales ratio is a way to identify “cheap” stocks. The price-to-sales ratio is simply the current stock price divided by the sales per share for the last four fiscal quarters (trailing 12 months). In the early editions of “What Works on Wall Street,” O’Shaughnessy found that the price-to-sales ratio was a very effective screen for stocks of all market-cap sizes and that low ratios consistently produced higher returns. A low price-to-sales ratio identifies these bargain-priced stocks and provides a meaningful value for comparison and analysis. Unlike earnings, sales are less subject to management assumptions, therefore more difficult to manipulate, and are often less volatile. The O’Shaughnessy Small Cap Growth & Value screen specifies a price-to-sales ratio of less than 1.50.
Earnings Per Share Growth
Earnings per share growth is a popular way to measure a company’s growth potential. Earnings per share plays a critical role in a stock’s price mainly due to market expectations. Low or negative earnings are often signs of young companies; however, these start-ups attempt to grow earnings quickly and can be profitable investments. The Small Cap Growth & Value screen finds stocks with earnings per share growth for the trailing 12 months that is positive.
Relative Strength
The relative strength index measures how well a stock has performed versus a benchmark over a certain time frame. A negative number indicates underperformance while a positive number denotes that a stock has performed better than the benchmark. Multiple-period price appreciation factors in the screen help to find companies that are growing earnings and have rising stock prices. This screen looks for stocks with above-average 13- and 26-week relative strength indexes.
Finally, the field is further narrowed to the 25 stocks with the highest 52-week relative strength. O’Shaughnessy found that stocks with the highest price changes over the past year tend to produce the highest returns the following year. Although this can be a very effective filter, he warns that it is a highly volatile approach. Stocks with high price appreciation may be at or close to their peaks, meaning they may have smaller upside and larger downside potential.
Number of Stocks
When constructing portfolios, O’Shaughnessy recommends purchasing 25 stocks for a micro-, small- or mid-cap portfolio (and at least 10 stocks for a large-cap portfolio). Because small- and mid-cap stocks are more volatile, additional stocks are needed to help diversify away some of the risks.
Profile of Passing Companies
Table 1 highlights the characteristics of stocks meeting O’Shaughnessy Small Cap Growth & Value screening criteria as of February 8, 2022.
Table 1. O’Shaughnessy Small Cap Growth & Value Screen Portfolio Characteristics
Many of AAII’s screening approaches search for stocks that are attractively priced relative to some measure of intrinsic worth. These screens usually incorporate traditional valuation metrics such as price-earnings ratio or price-to-book-value ratio as primary screening criteria.
Stocks with a low share price relative to their trailing sales per share make up the starting universe for O’Shaughnessy, so it is not surprising to find that passing stocks have a median price-to-sales ratio of 0.91—well below the median value of 2.69 for all exchange-listed stocks. These stocks are also priced attractively on an earnings basis with a median price-earnings ratio of 10.2 versus 17.8 for all stocks. However, the price-to-book-value ratio for the O’Shaughnessy approach is higher on a relative basis—2.68 compared to 1.90 for all stocks. Only nine of the passing stocks are currently paying a dividend, so the median (midpoint) dividend yield is 0.0% for the passing stocks. The average yield happens to be 1.3% for the passing stocks.
The O’Shaughnessy screen only looks for a positive year-over-year increase in earnings, yet it is interesting that the historical five-year earnings per share growth rate for the stocks currently passing the screen is only 1.0%, well below the median growth rate of 6.3% for the exchange-listed stock universe. The companies passing the screen do not have enough analyst interest to gather long-term earnings growth estimates, therefore they do not possess meaningful price-earnings to growth (PEG) ratios based upon the projected growth rate.
The $783.3 million median market cap of the O’Shaughnessy Small Cap Growth & Value screen is reasonable given the criteria of the approach. These companies are just below the midpoint of the $832.1 million market cap median of all exchange-listed stocks.
The O’Shaughnessy Small Cap Growth & Value stocks are notable for their strong relative strength compared to the typical exchange-listed stock. The median relative strength index of 56.2% indicates that these stocks have outperformed the S&P 500 by 56.2 percentage points over the last 52 weeks. In contrast, the typical exchange-listed stock has underperformed the S&P 500 by 22.1% over the same period.
The 25 companies that met the O’Shaughnessy Small Cap Growth & Value criteria as of February 8, 2022, are listed in Table 2 ranked by 52-week relative strength index.
Table 2. Companies Currently Passing the O’Shaughnessy Small Cap Growth & Value Screen (Ranked by 52-Week Relative Strength Index)
Go to AAII Guru Screens for an updated list of stocks passing this screen.
Final Thoughts on O’Shaughnessy Small Cap Growth and Value Approach
O’Shaughnessy encourages investors to choose the strategies that match their risk tolerance and investment philosophies.
As an advocate of diversification, he recommends combining many strategies to create a portfolio of small-, mid- and large-cap growth and value stocks. By combining approaches, investors can reap the benefits of upswings in one asset while minimizing the effects of a slow or down market in another.
Although many investors believe that the market will return about 10% per year over the long term, O’Shaughnessy notes that this number does not take inflation into account, which can eat away at returns; many investors fail to consider this when calculating portfolio performance.
O’Shaughnessy calculated the long-term inflation-adjusted average return to be about 7% per year and believes that the market will always revert to this mean. If the market has returned greater than 7% per year on an inflation-adjusted basis over several years, it will spend the next years regressing back toward the average, often overshooting this mark and falling below it.
Related

Portfolio Strategies
To Beat the Market, Invest Differently Than the Market
Related

Value Investing
Valuation Metrics
Discussion
FREE REPORT

ROBERT A from NC posted over 4 years ago:
JAYANTILAL P from PA posted over 4 years ago:
TONY H from MD posted over 4 years ago:
You need to log in as a registered AAII user before commenting.
Log InCreate an account