


Related

Portfolio Strategies
Volatility is the most common proxy for measuring investment risk and should consider the portfolio impact of diversification.

Merriam-Webster defines investment risk as the chance that an investment will lose value. As investors, we should be compensated with higher expected returns for investments that have greater variability of return and are more likely to decline in value. Volatility is the most common proxy for measuring investment risk and should consider the portfolio impact of diversification.
We cannot simply look at the volatility statistics of a single stock or fund without considering how it interacts with the rest of the portfolio. The time frame of your investment also plays a crucial role in the risk management of your investment. With a shorter time frame, you must be willing to accept a lower expected return or experience a greater chance that your investment will have a lower value than expected when you need to access your funds.
Here, we discuss beta, standard deviation, the risk index and risk-adjusted returns and where to find these numbers on AAII.com. While there may be better measures of risk than the ones in common use, as an individual investor you are limited to popular measures if you want to be able to make useful comparisons.
Risk Index
Security standard deviation ÷ Market standard deviation
Risk-Adjusted Return for Mutual Funds
[(Market standard deviation ÷ Fund standard deviation) x (Fund return – T-Bill return)] + T-Bill return
Risk-Adjusted Return for a Portfolio
[(Benchmark standard deviation ÷ Portfolio standard deviation) x (Portfolio return – Margin rate)] + Margin rate
Beta is a measure of relative volatility for a stock, a stock mutual fund or exchange-traded fund (ETF) or a portfolio. It compares the volatility of the security or portfolio to that of the market—a beta of 1.0 indicates volatility equal to that of the market, while a beta greater than 1.0 indicates more volatility and a beta less than 1.0 indicates less volatility than the overall market. The S&P 500 index is the most common index used in comparing a security’s volatility.
Beta is limited as a measure of volatility in several ways: The S&P 500 is not a very good index of the complete market basket available to an investor; various segments of the economy move at different times in the economic cycle, which can result in a beta that is not really reflective of true long-term volatility; and beta does not allow comparison of different kinds of investments—for instance, stocks versus bonds.
The use of beta to measure stock, fund and portfolio volatility has fallen out of favor over the years as investors tend to look more at standard deviation to measure volatility. When using beta, keep in mind that the measure only accounts for market-related risk. A companion statistic, R-squared, helps to explain how closely the investment’s movement was related to the underlying index.
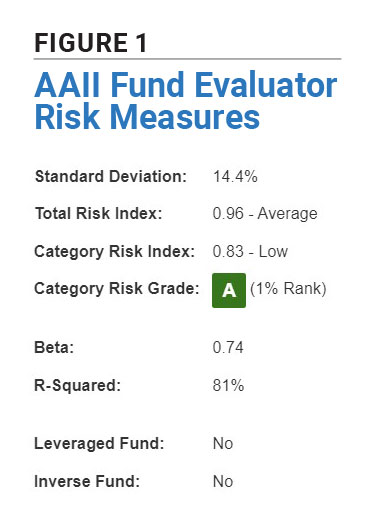
On AAII.com, all members can see the beta for individual stocks and stock funds at the security’s Evaluator page, accessed by typing a name or ticker into the search bar at the top of AAII.com pages. Fund and ETF Evaluators also show the R-squared measure (Figure 1), while the Stock Evaluator presents the beta for the company’s industry for comparison.
Standard deviation is a useful risk measure for individual investors—as long as you understand the limitations. The figure indicates the amount by which most actual returns varied around the average return over a period of time. It thus provides a measure of volatility—the higher the standard deviation, the greater the volatility. For example, a standard deviation of 10% indicates that most (two-thirds) of the actual returns over a particular period varied around the average return by plus or minus 10%—in other words, if the average return was 17%, most of the actual returns ranged from 7% to 27%.
Standard deviation is calculated as the square root of the average of the deviations from the average, squared. The primary limitation of standard deviation as a measure of stock risk is that it assumes returns are “normally” distributed—in other words, actual returns follow a bell curve above and below the average return. In the real world, this is typically not the case.
On AAII.com, standard deviation is reported for mutual funds and ETFs on the security’s Evaluator page.
The risk index can provide more context about the volatility relative to the market than the standard deviation gives. The risk index metric divides the standard deviation of returns for a stock, fund or portfolio by the standard deviation of return for a benchmark.
The benchmark can be a broad market index (e.g., the S&P 500) or the average of a category of stocks or funds. AAII’s Dividend Investing, Stock Superstars Report and VMQ Stocks model portfolios use the iShares Dow Jones U.S. ETF  (IYY) as their benchmark. The ETF seeks to track the investment results of a broad-based index composed of U.S. equities. Thus, the risk index shows whether the tracking portfolios—and their holdings—have experienced more or less volatility than the iShares Dow Jones U.S. ETF.
The risk index uses a baseline value of 1.00, which denotes average risk—meaning the security, fund or portfolio experiences the same level of volatility as the benchmark. Values above 1.00 indicate greater volatility than the benchmark. Conversely, values below 1.00 indicate less volatility than the benchmark. In simplified terms, the higher the risk index, the more likely the price will experience more significant increases and declines than the underlying benchmark.
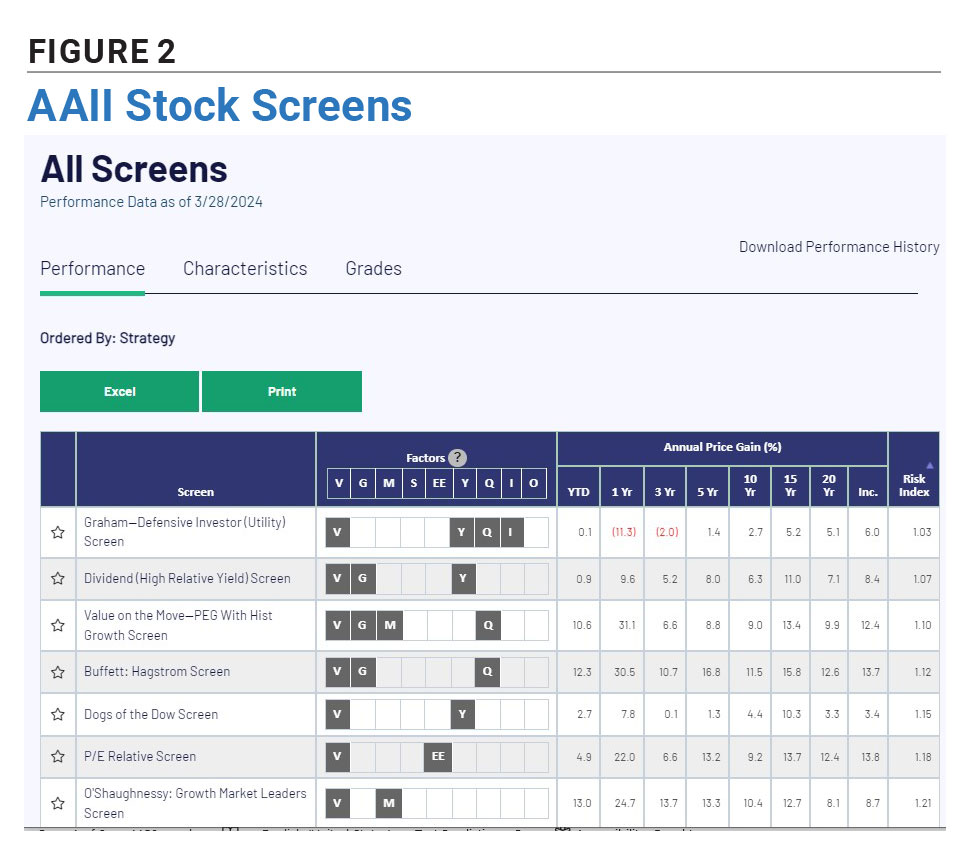
For the 55 stock screens tracked on AAII.com, a risk index is calculated by dividing a screen’s annual price change standard deviation since inception by the annual price change standard deviation of the S&P 500 since inception (Figure 2).
For individual mutual funds and ETFs, the Evaluator reports a category risk index (the standard deviation of a fund’s return divided by the standard deviation of return for the average fund in the fund’s category) and a total risk index (the standard deviation of a fund’s return divided by the standard deviation of return for all funds or ETFs). The category risk index is accompanied by an A–F grade, assigned based on the percentile rank of the category risk index compared to that of all funds in the same category.
One way to produce an easily understood marriage of risk and return is to adjust the security’s return for risk so that it assumes risk is equal to that of the market benchmark. Volatility above the market benchmark will result in the return being proportionally lowered, while less risk (lower standard deviation than the benchmark) will adjust a return proportionally upward. The result is the risk-adjusted return.
A risk-adjusted return that you can easily calculate is the three-year historical performance of a stock or fund divided by its three-year risk index. The benefit of using this particular figure is that the risk index component of the ratio standardizes a stock’s volatility to a benchmark, allowing you to gauge the volatility of a stock, fund or portfolio in terms of the benchmark of your choosing.

On AAII.com, the Equity Risk-Adjusted Return table (Figure 3) includes all stock mutual funds and is available at the bottom of the Mutual Funds webpage. In addition to the three-year average annual risk-adjusted return, the table also reports the market risk index, the standard deviation of the fund relative to the volatility of the S&P 500 and the three-year average annual return. Data is updated monthly.
Portfolio Strategies

Portfolio Strategies


JOHN L from NJ posted over 2 years ago:
ROBERT A from NC posted over 2 years ago:
JOHN D from LA posted over 2 years ago:
BARRY J from TX posted over 2 years ago:
You need to log in as a registered AAII user before commenting.
Log InCreate an account