

Related

Stock Strategies
Growth, inexpensive valuation and an appealing dividend were cited by survey respondents as desirable traits in stocks.

Charles Rotblut leads a class in AAII's new Essential Investing Video Course. Go to https://www.aaii.com/ves for more information and to subscribe.
What characteristics do individual investors look for when analyzing a stock? We asked a random sample of AAII members what they seek out in our latest Big Question survey.
At the aggregate level, the responses paint a picture of an individual investor who follows what could best be described as a growth at a reasonable price (GARP) income-seeking approach. This investor wants a dividend-paying growth stock trading at a reasonable price.
This characterization certainly does not describe all AAII members who responded to the survey. There was not a single characteristic that stood out as a must-have trait in stocks. Rather, surveyed members are looking for a variety of traits, with preferences varying by investor.
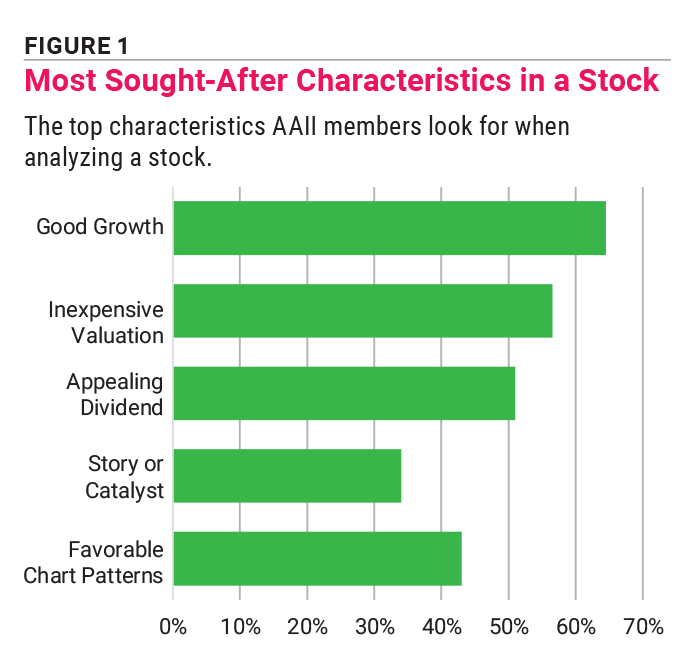
Growth did stand out as the most sought-out characteristic, however (Figure 1). It was selected by nearly two-thirds of respondents (65%) from the five choices we gave them. (Respondents had the option of selecting more than one answer.) Inexpensive valuations were not far behind at 57%. An appealing dividend was third at 51%. Despite the media attention given to a company’s latest news, just one out of three respondents (34%) said they look for a story or catalyst for the stock price to increase.
The Big Question survey is part of a periodic initiative to give AAII members a chance to talk about their investment decisions and challenges. Each survey asks what we’re describing as a “big question” about a subject of interest to many individual investors. A randomly selected group of AAII members is asked a specific question, as well as follow-up questions intended to provide more clarity and background. Approximately 200 AAII members responded to the latest survey, which was conducted in early April 2024.
Seeking more insights into their preferences, we asked the surveyed AAII members what information they look at when analyzing a stock. Fundamental data (e.g., financial statements, valuation ratios, etc.) was picked by 84% of respondents. This is not surprising, given the characteristics that individual investors seek out in stocks.
Earnings reports, company press releases and conference call transcripts are looked at by 46%. Regulatory filings required by the U.S. Securities and Exchange Commission (SEC) aren’t nearly as considered; just 19% of surveyed individual investors said they look at them. Furthermore, companies’ investor relations websites are only used by 12%.
Research done by brokerage analysts plays a role, however. Many respondents (57%) said they consider analyst recommendations and reports as part of their process for analyzing a stock. Earnings estimates, which are published by brokerage analysts, are considered by 52% of respondents. (We allowed respondents to select more than one response to this multiple-choice question as well.)
Technical analysis is used by many respondents. Sixty-three percent said they consider stock charts or other relative price strength measures when analyzing a stock.
We decided to drill down further by asking how important technical analysis indicators are—such as moving averages, the moving average convergence/divergence (MACD) indicators‚ etc.—to AAII members’ investing processes. Here we saw a split.
The largest group (46%) described such indicators as being somewhat important. “Not important” was chosen by 38%. At the other end, only 17% of respondents view technical analysis as being very important to their analytical process.
Individual investing approaches often aren’t static but rather evolve over time. We saw this among the respondents to this Big Question survey.
A particularly notable shift was a greater emphasis placed on fundamentals and/or dividends and income. Survey respondents discussed how they consider long-term financial health indicators such as cash flow, earnings and debt management when determining if a stock is a worthy candidate for their portfolio.
Sakari Virkki is among those who have adjusted what they focused on. “As interest rates are at multiyear highs, debt has become a more important factor in my analysis.” In a follow-up email, Virkki added, “About five to eight companies I have owned have entered bankruptcy protection. I avoided huge losses by selling those stocks because of their debt levels. Because of demand for high profitability, U.S. companies tend to have high gearing. That certainly increases risks as rates go higher.” [Gearing is the amount of debt used to fund operations in proportion to a firm’s equity capital.]
Life stage changes play a role. Many respondents wrote about adjusting their strategies as they near retirement or are now in retirement. The coinciding desire for portfolio income through dividends makes a company’s underlying financial strength more important. Similarly, we heard from respondents who prefer more stable companies and stocks as opposed to more volatile ones.
“While I was working, I was mostly invested in growth stocks until age 55, then I included some bonds,” explained Robert Hadley. “Now that I am retired, I have switched to dividend stocks for income.”
Some respondents have shifted to placing a greater emphasis on technical analysis. Kevin Kokernak is one of them: “I used to be more of a value investor and relied more on fundamental analysis. Now I am much more growth- and income-oriented and rely more on chart patterns and technical analysis.”
Dave Dejno strikes a middle ground. “I’m using more of a holistic approach of looking at fundamentals, technical analysis and management effectiveness against a backdrop of overarching socioeconomic trends and geopolitical realities.”
While age and life stages impact investing approaches, market conditions do not have the same influence. The most common response to the survey question “How do prevailing market conditions affect your strategy for analyzing and selecting stocks?” is exemplified by Donald Schmidt: “Prevailing market conditions don’t really affect my decisions.”
Some individual investors have grown accustomed to using market downturns as buying opportunities. Robert McAvoy is one of them: “I try not to buy when everything is up. Rather, I’ve become more attuned to buying opportunities in down markets. When they occur, I buy from preplanned lists of stocks I’m interested in.”
Most of the individual investors we surveyed use AAII resources to find investing ideas. Three-quarters (76%) use some combination of the AAII website, stock screens, newsletters, Stock Investor Pro and the AAII Journal.
Nearly the same percentage of respondents (75%) also make use of non-AAII websites, newsletters and publications. Analyst and brokerage recommendations were a distant third when it came to finding ideas at 33%. Ranking last was relying on friends or online forums; just 16% said this was their primary source for ideas.
Signs of weak quality are the biggest reason AAII members pass on a stock. Lousy underlying fundamentals, signs of poor management, losses and/or disappointing earnings were cited by 26% of respondents. Nearly one out of four (22%) respondents said they pass on a stock when the valuation is too high.
Ron Harris listed three reasons for passing on a stock: “an excessively high price-earnings (P/E) ratio compared to the revenue growth rate, because there probably won’t be a good long-term result; an excessively high debt-to-equity ratio, because the company will probably struggle to sustain good results during periods of financial stress; and negative earnings when competitors are profitable, because those losses are indicative of poor management.”
Other survey respondents gave a variety of reasons for passing on a stock. Their open-ended responses include high levels of debt (10%), market or sector trends (8%) and technical analysis reasons (6%).
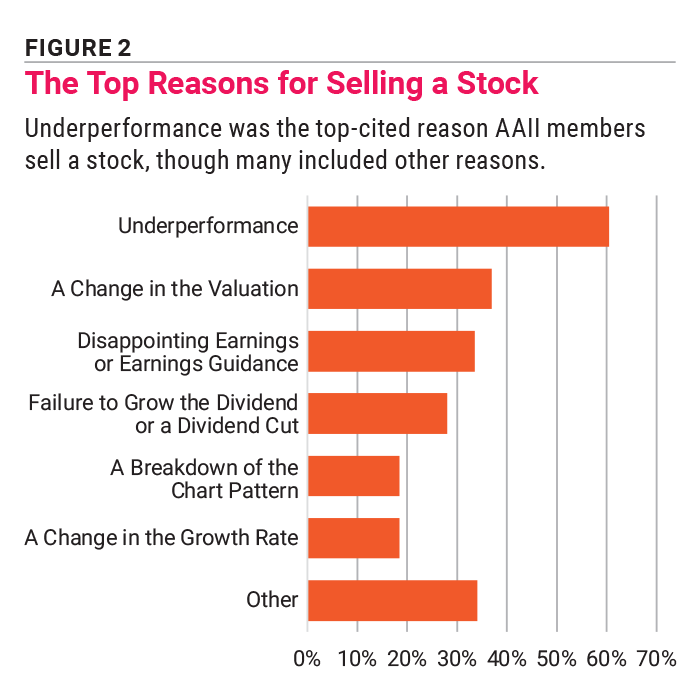
Since we were asking about what leads AAII members to buy a stock, we also asked what prompts them to sell a stock they currently own. Approximately three out of five (61%) respondents chose “underperformance” out of the multiple-choice answers offered, as shown in Figure 2.
James Kaufman sells “at least a portion if there is a decline of 20% from the stock’s high since purchase. I will also sell a portion if there is an increase of 50% from the purchase price unless a company’s growth rate has increased.”
Changes in the valuation and disappointing earnings or earnings guidance were a distant second and third, at 37% and 34%, respectively.
Thomas Kneubuehl described valuation as a key part of what he considers the most successful sell rule. “No matter the company, industry or its related growth rate, a stock investment is the purchase of discounted cash flows or earnings. An investor strives to buy them at reasonable risk-adjusted return measurements versus other investments. All things being equal, a stock should be sold when another stock or investment has more reasonable risk-adjusted return measurements with respect to discounted cash flows or earnings. Taxes create friction in this analysis but should not create paralysis if investing in other stocks or investments that have a superior long-term risk-adjusted return. Measuring discounted cash flows or earnings is hard to calculate but it is the essence of investing.”
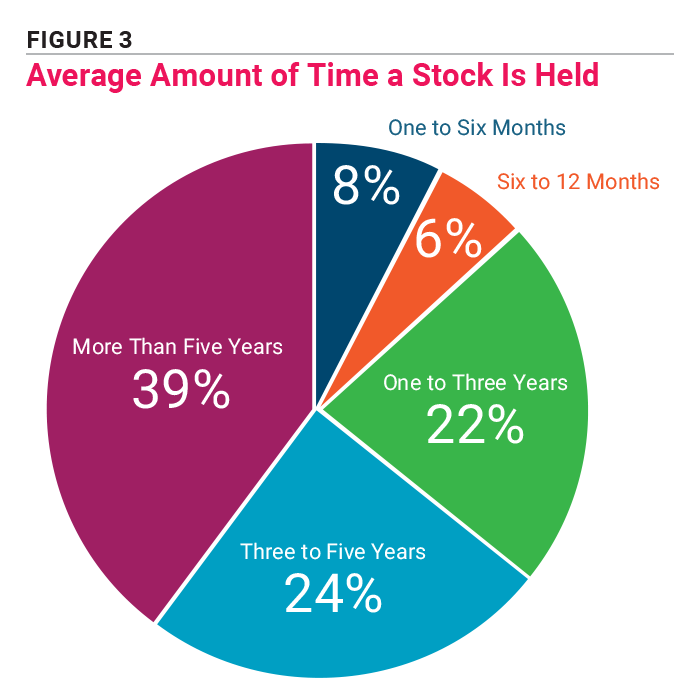
Most take a longer-term approach toward investing. The majority (63%) say their average holding period is three years or longer. An additional 22% have an average holding period of one to three years, as Figure 3 shows.
Most respondents described their knowledge of investing as either intermediate or advanced.
The number of stocks held varied widely. The median response was 25 stocks. More than one-third of respondents (36%) hold 20 or fewer stocks. At the other end, 12% told us that they hold more than 50 stocks.
More than one-third (36%) look at their stocks at least once per day. A quarter (25%) of respondents look “a few times per week.” About 15% look at their stocks weekly.
Stock Strategies

AAII Community


JOHN L from NJ posted over 2 years ago:
ROBERT A from NC posted over 2 years ago:
CHARLES M from VA posted over 2 years ago:
James F from USA posted almost 2 years ago:
MARK E from IA posted 11 months ago:
You need to log in as a registered AAII user before commenting.
Log InCreate an account