



Featured Tickers:
By investing in large-cap stocks, the individual investor secures a foothold in the general market. Stock holdings of the largest domestic companies make up the core equity investments for most investors. The largest companies in the U.S. generate more revenue than most countries in the world. Company size can be variously measured but is most commonly done with market capitalization.
Market cap is calculated by multiplying the number of shares outstanding by the current share price, representing the market’s collective view of the value of a company. Large-cap stocks occupy a majority of the total domestic equity market cap, 84.5%, as of the end of 2021 (Table 1). This compares to mid-cap stocks’ 11.2% of the total market cap and small-cap and micro-cap stocks’ combined 4.4% of the total market cap.

Owning a diversified portfolio of large-cap stocks provides overall market coverage, meaning the portfolio will generally move with the market. The standard deviation of large caps’ annualized return between 1926 and 2021 is indicative of this, as it is the lowest of the four market-cap groups at 19.6% in Table 1. Investing in the largest U.S. stocks over the long term has resulted in less volatility in annualized returns because these firms make up most of the market.
However, the cost of reduced volatility is lower overall annualized returns. Large caps’ long-term annualized return of 10.5% since 1926 compares to mid caps’ 11.2%, small caps’ 11.6% and micro caps’ 12.3%. Though the differences in returns are relatively small between these market-cap groups, they can make a large difference over the course of a lifetime of investing.
Regardless, investing in a diversified portfolio of large-cap stocks is investing in what is essentially the S&P 500 index, often the standard benchmark for the market. Five hundred firms compose the large-cap category in Table 1.
While an investor might want to manage their own equity holdings, mutual funds and exchange-traded funds (ETFs) can do the work of building a diversified portfolio and following a strategy at a competitive price.
Large-Cap Categories by the Numbers
Equity usually makes up some portion of an investor’s portfolio holdings. The long-term return of stocks compared to other asset categories is simply too good to exclude from a diversified portfolio, provided the time horizon is long enough to absorb the volatility that comes with the potential return.
How much equity you choose to hold is a personal decision. AAII’s Asset Allocation Models suggest all-weather options for long-term investors. The Conservative Investor model consists of 40% diversified equity, the Moderate Investor model consists of 60% diversified stock and the Aggressive Investor model consists of 90% diversified stock. Large caps make up at least 20% of each of these model portfolios’ equity holdings.
In each model, large caps are represented by the Vanguard 500 Index Admiral Shares fund  (VFIAX) and its ETF equivalent with the ticker VOO. Within Morningstar’s fund data set, these two funds are in the large blend category. Funds in this category are considered to be fairly representative of the overall U.S. stock market in size, growth rates and price, and consist of stocks in the top 70% of the domestic market cap.
Blend funds’ distinction (or indistinction) is that they lack the characteristics of either a growth- or value-based stock selection strategy. Generally, large blend funds feature broad exposure, investing across the spectrum of U.S. industries, which makes their returns often similar to those of the S&P 500.
This lends the large blend category to mainly passive index strategies, borne out through the numbers in AAII’s Funds+ and ETF+ Screeners. The blend category comprises 49% of the total 461 large-cap ETFs. The large growth and large value categories about equally split the remainder of the large-cap ETF universe. ETFs are primarily known for following passive index strategies; the low cost of managing such strategies is one of the main features that makes these ETFs competitive with similar mutual funds.
The blend category comprises 34% of the 3,490 large-cap mutual funds. All three categories—blend, growth and value—are roughly equal in number, with the latter two comprising 34% and 32% of the total large-cap mutual fund category, respectively. Compared to the large-cap ETF universe, the lower proportion of blend funds fits in with mutual funds being more likely to pursue active strategies. And, in general, the mutual fund universe remains vastly larger than the ETF universe, with 24,026 total mutual funds and 3,033 total ETFs in AAII’s current data set.
Large caps make up the majority of the domestic equity universe for both ETFs and mutual funds, with 64% and 55%, respectively. Again, it follows that since more mutual funds have active strategies, their percentage of the equity market-cap category would be larger than that of ETFs. In fact, small-cap mutual funds comprise a larger share (25%) of all domestic equity mutual funds than mid-cap funds (20%).
Large-Cap Growth and Value Tilts
Investors looking for tilts outside of following the market can look at large value and large growth mutual funds and ETFs. Large growth funds primarily invest in big U.S. companies that are projected to grow based on high growth rates for earnings, sales and cash flow. Such companies typically have high valuations as determined by high price multiples and low dividend yields. These funds focus on rapidly expanding industries.
Large value funds primarily invest in U.S. companies that are less expensive while placing less emphasis on rising sales and earnings—opposite characteristics of growth funds. Value is based on low price multiples relative to earnings, cash flow or assets and high dividend yields. Stocks can shift from growth to value or from value to growth as their prospects change. For example, Facebook parent Meta Platforms Inc. (META) has moved from the Russell 1000 Growth index to the Russell 1000 Value index this year since it is currently trading at low valuations.
As shown in Tables 2 and 3, average annualized one-year returns across the blend, growth and value categories reiterate the market’s recent story in 2022. Growth investments are down much more than value investments due to investors’ perceived changes in the economy. The blend category fits between growth and value in terms of one-year annualized return.
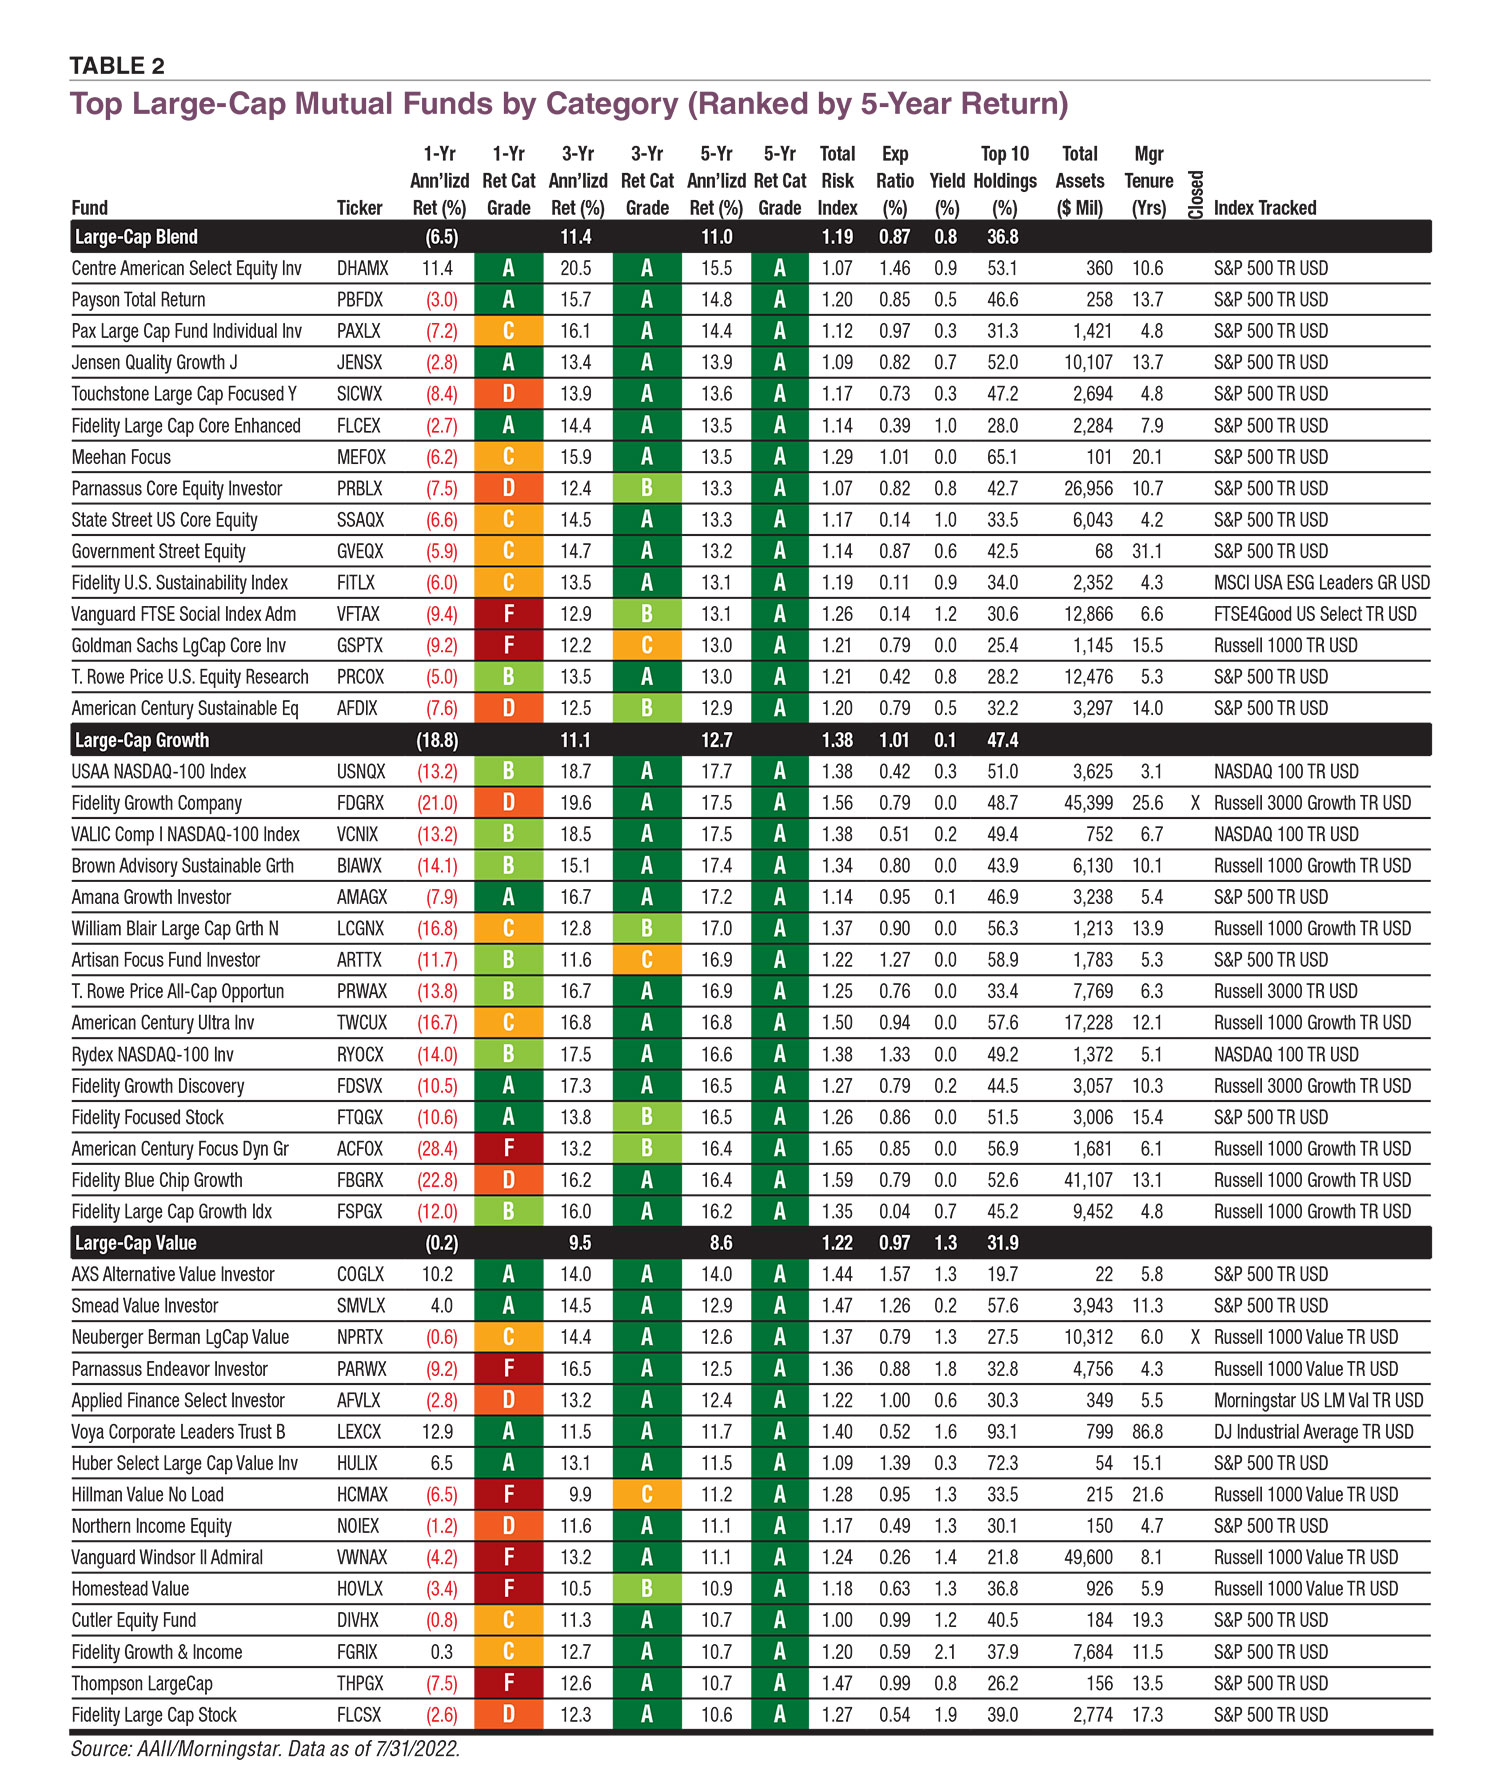
Download the Excel spreadhseet of this table.
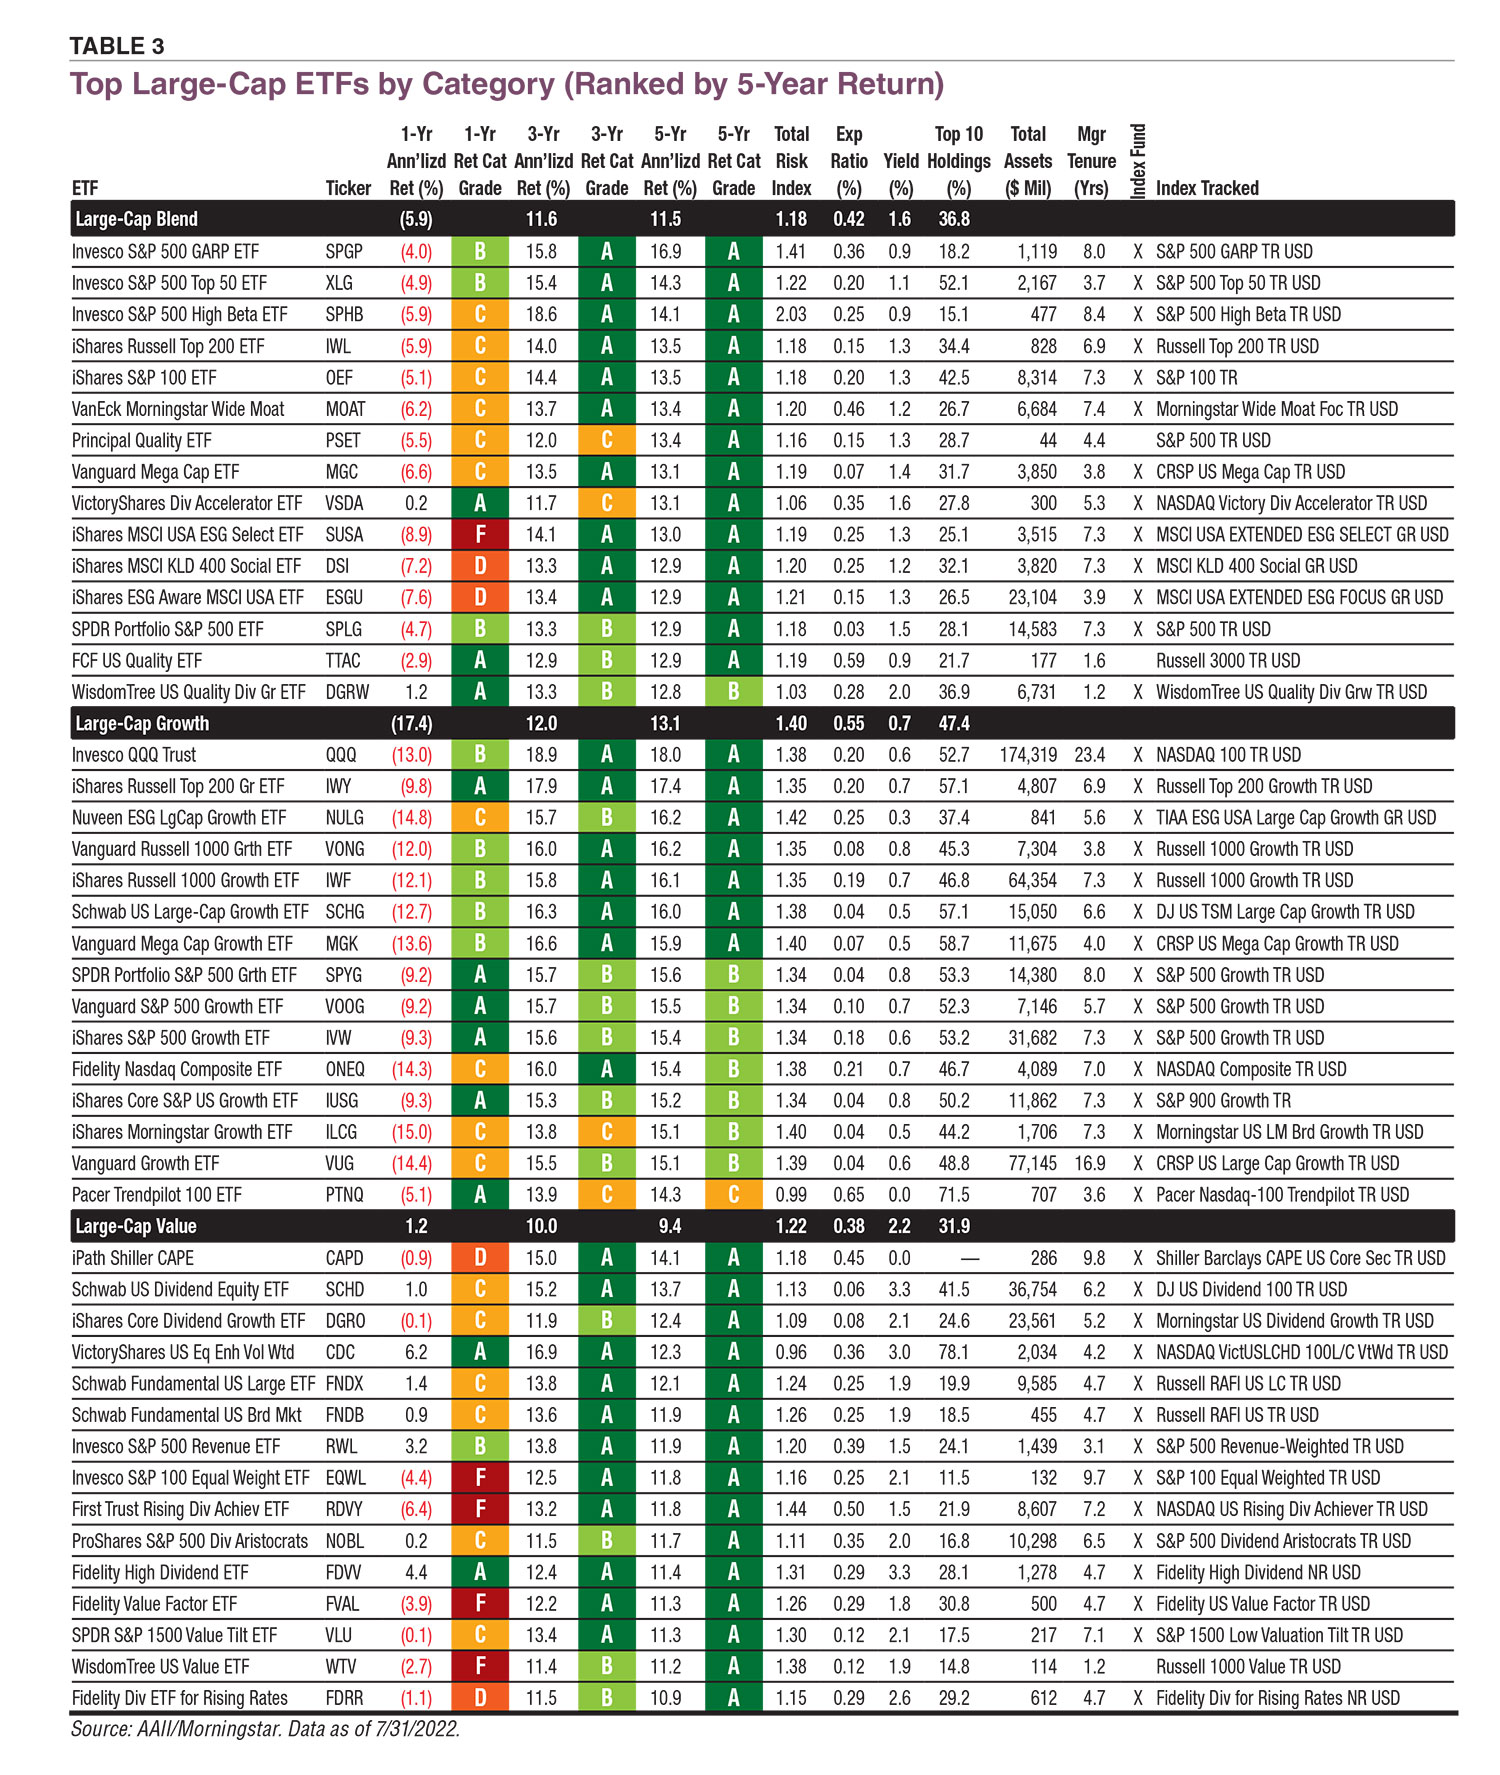
Download the Excel spreadsheet of this table.
Basic Fund Screener Characteristics
To arrive at the list of funds in Tables 2 and 3, a few filters were added beyond the U.S. equity market-cap categories. These filters provide a base to begin the selection process when looking to add a large-cap mutual fund or ETF to your holdings. However, further due diligence is still required.
The mutual funds in Table 2 are screened to be no-load, manage total assets of more than $5 million, not use leveraged or inverse trading strategies, have a minimum initial purchase threshold no higher than $50,000 and be generally available for purchase by individual investors, meaning they are not institutional funds or exclusive share classes.
The ETFs in Table 3 are screened along a similar basis: manage total assets of more than $25 million, have an average daily trading volume of more than 5,000 shares and not use leveraged or inverse trading strategies.
The mutual funds and ETFs in both tables are ranked by five-year return to emphasize the performance of management. Longer periods of performance provide a closer proxy to management’s ability than shorter periods, since there are many more extraneous factors that affect short-term performance than long-term performance. Of course, past returns are not indicative of future returns, but comparing long periods of performance with manager tenure may steer you from one fund to another.
Top-Performing Large-Cap Mutual Funds
Looking at the list of mutual funds in Table 2, the Vanguard 500 Index Admiral fund (representing large caps in AAII’s Asset Allocation Models) doesn’t make the list of top performers in the large-cap blend category. Its five-year annualized return of 12.8% puts it just off the list, though it does have a five-year return category grade of A (top 20% within category).
What stands out most in the large-cap blend category is the top mutual fund, Centre American Select Equity Investor (DHAMX), with a one-year annualized return of 11.4%. This utterly bucks the category average one-year return of –6.5%. In comparison, Vanguard 500 Index Admiral has a one-year annualized return of –4.7%. The Centre American fund’s one-year return is most likely due to its holdings in Exxon Mobil Corp. (XOM) and Chevron Corp. (CVX), both part of the energy sector and the oil & gas refining and marketing industry—representing the largest energy companies in the U.S.
As previously mentioned, large caps comprise 84.5% of the total domestic equity market cap. Only a small portion of the number of companies available through U.S. exchanges account for all this valuation—14.4% (Table 1). In comparing large-cap funds, it’s important to consider the breadth of the portfolio’s holdings, represented by the percentage of the fund’s assets held in its top 10 holdings in Tables 2 and 3.
The Centre American fund has a higher-than-average percentage of its assets in its top 10 holdings of 53.1% compared to the large blend category average of 36.8%. The high weighting in energy sector holdings has been especially beneficial to the fund this year.
In comparison, the top 10 holdings in Vanguard 500 Index Admiral make up only 27.0% of its assets. The top two holdings, Apple Inc. (AAPL) and Microsoft Corp. (MSFT), are 6.55% and 5.98% of the fund, respectively. The third-largest holding, Amazon.com Inc. (AMZN), has a weight of only 2.90%, with the remaining seven at smaller weights. Centre American Select Equity holds Apple and Microsoft with respective weights of 5.91% and 5.29% as its top two holdings, slightly lower, but the remainder of its top 10 holdings all have weights above 3.00%.
Centre American Select Equity has a total of 47 holdings compared to Vanguard 500 Index Admiral’s 506.
The Centre American Select Equity fund has the highest expense ratio of the top-performing large blend funds, at 1.46%. In all of Table 2, its expense ratio is second only to the top-performing large value fund, AXS Alternative Value Investor (COGLX), which has an expense ratio of 1.57%. In comparison, Vanguard 500 Index Admiral has an expense ratio of 0.04%.
Top-Performing Large-Cap ETFs
The ETF equivalent of the Vanguard 500 Index Admiral fund, the Vanguard S&P 500 ETF (VOO), also doesn’t make the list of top performers in the large-cap blend category (Table 3). But it is also just off the list with a five-year annualized return of 12.8%, and like its mutual fund counterpart also has a five-year return category grade of A.
The top-performing large blend ETF is the Invesco S&P 500 GARP ETF (SPGP). GARP is an acronym for growth at a reasonable price, essentially a fundamental analysis strategy that tries to balance growth and valuation. This ETF differs from the Vanguard S&P 500 ETF in its strategy, which follows an index that focuses on just 75 growth stocks in the S&P 500 with relatively high quality and value composite scores.
The weight of each holding in the Invesco S&P 500 GARP ETF is fairly evenly distributed. Compared to the Vanguard S&P 500 ETF’s top 10 holdings’ weight of 27.0% of its assets, the Invesco S&P 500 GARP ETF has 18.2% of its assets in its top 10 holdings. Its two top-weighted holdings are NRG Energy Inc. (NRG) and eBay Inc. (EBAY)— each comprises 1.95% of the portfolio. The Invesco S&P 500 GARP ETF has 77 holdings to the Vanguard S&P 500 ETF’s 506.
Despite the Invesco S&P 500 GARP ETF’s expense ratio of 0.36% being below the large blend category average, it still cannot beat Vanguard on this criterion. The Vanguard S&P 500 ETF’s expense ratio of 0.03% is even a bit smaller than that of its twin, the Vanguard 500 Index Admiral mutual fund.
Conclusion
A large-cap mutual fund or ETF can easily represent an individual investor’s general buy-and-hold-the-market equity portion of their diversified portfolio. This is especially the case with the large blend category, but there are options for growth or value strategies as well if you are interested in a tilt with lesser correlation to the market. When considering large-cap funds, there are many to choose from since this category comprises most of the domestic equity market cap.
Although past returns are not a guarantee of future returns, better long-term performance tied with a parallel management tenure and lower costs may indicate a more attractive fund in the competition between peers. Since large-cap funds in general follow the market and will likely be the most stable equity portion of a diversified portfolio that includes small-cap, mid-cap or international stock funds, it is important that your large-cap fund can hold up against its peers.

Related

First Cut Mutual Funds
Large-Cap Growth Funds Performing Well Compared to Peers
Related

First Cut ETFs
Large-Cap Value ETFs With Consistent Strong Performance
Discussion
FREE REPORT

Get your free copy of our special
report analyzing the tech stocks
most likely to outperform the
market.
Sneha J from IND posted over 4 years ago:
PIERRE M from CAN posted over 4 years ago:
You need to log in as a registered AAII user before commenting.
Log InCreate an account