


Related

PRISM Wealth-Building Process
How to more effectively use return data to help determine whether a fund is a worthy investment.

Charles Rotblut leads a class in AAII's new Essential Investing Video Course. Go to https://www.aaii.com/ves for more information and to subscribe.
When analyzing a mutual fund or exchange-traded fund (ETF), investors pay particular attention to past returns with good reason. While past performance cannot predict future returns, it can provide useful insights. Here, we offer suggestions on how to more effectively use return data to help determine whether a fund is a worthy investment.
All AAII members can view return data and the associated A+ Investor Grades on more than 24,000 mutual funds and 2,700 ETFs by going to the respective mutual fund and ETF evaluator pages on AAII.com. To access either, simply type the ticker symbol or name of the fund you wish to look at in the search box located in the upper left-hand corner of any page on AAII.com.
All else being equal, a record of higher relative returns is generally preferable. By “relative,” we mean that mutual funds and ETFs should be compared against their peers because different types of funds invest in different types of investments. Just because a mid-cap value fund has fared better than an emerging markets stock fund or an intermediate-term government bond fund doesn’t mean it’s a good mid-cap value fund.
Peer performance allows you to do an apples-to-apples comparison. A fund can realize good absolute returns because its category has been in favor, but still lag its peers in terms of performance.
The A+ Investor Grades make peer-to-peer comparisons easy. Funds with above-average returns relative to their peers are assigned return grades of A or B. Funds with below-average category returns are assigned grades of D and F.
You will want to pay attention to both the annualized and the year-by-year returns. The annualized returns show how a fund has performed over different periods of time, giving you a higher-level viewpoint of performance. Year-by-year returns give you a detailed look at the consistency of returns.
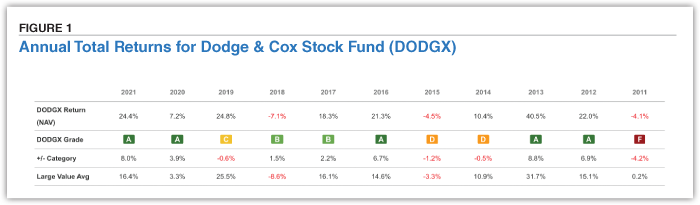
Figure 1 shows the year-by-year returns for Dodge & Cox Stock fund  (DODGX), an actively managed large-cap value mutual fund. The fund has one-, three-, five- and 10-year annualized grades of A. Though good, the fund does not beat its peers every year, as the year-by-year returns show. Over the 10-year stretch of 2011 through 2021, the Dodge & Cox Stock fund trailed its peers four different times (2011, 2014, 2015 and 2019).
When this fund does beat its peers, the performance tends to be very good. It realized grades of A for its relative returns in 2012, 2013, 2016 and 2020. During the first nine months of 2021, the fund was on pace to handily beat its category peers again.
Seeing an actively managed fund swing between years of outperformance and underperformance is not unusual. In fact, it would be expected if the fund is truly managed in a way to be different than the market. You can identify whether a fund is truly active by looking at the R-squared, which represents the percentage of a fund’s movement that can be explained by movements in the S&P 500 index. The lower the number, the more truly active the fund is.
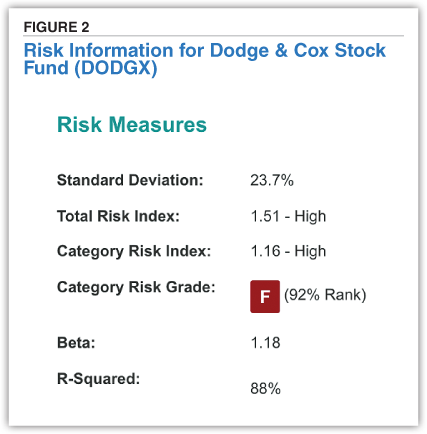
The Dodge & Cox Stock fund has an R-squared value of 88% (Figure 2). This is noticeably lower than the Vanguard Mid Cap Index Admiral fund (VIMAX) R-squared of 94% and suggests that the managers of the Dodge & Cox fund are following a truly active approach. A closet index mid-cap fund will have an R-squared value close to that of the Vanguard Mid Cap Index fund.
Keep in mind that an actively managed approach does not mean a strategy with excessive levels of trading. The Dodge & Cox Stock fund follows a buy-and-hold approach, as is evident by its low portfolio turnover ratio of 21%.
Another way to put performance into perspective is to look at risk. Two measures of risk can be found on the evaluator pages: total and category. Total risk compares the volatility of a fund’s returns over the past three years to the three-year volatility of returns for all funds. Category risk compares the volatility of a fund’s returns to that of its peers.
A risk index above 1.00 indicates more relative volatility; a reading below 1.00 indicates less relative volatility. The Dodge & Cox Stock fund has a category risk index of 1.16 and a category risk grade of F. Though shareholders have been compensated for the higher volatility with higher returns, you will need to assess your comfort level since a higher-risk fund could remain riskier than its peers in the future.
While a review of historical returns, R-squared values and risk indicators should be conducted before purchasing a mutual fund or ETF, and periodically after purchase, there are situations where you should consider placing more emphasis on these numbers and situations where you can place less emphasis on them.
Actively managed funds require more scrutiny. These funds typically charge higher expense ratios than their passively managed (index) peers, so you want to ensure that the odds being compensated for the higher costs are better. Every additional basis point that a fund charges is an additional return you will have to realize just to match the returns of a lower-cost index fund. Dodge & Cox Stock fund’s expense ratio of 0.52% means the fund must achieve an annualized return that is 47 basis points higher than that of the Vanguard Mid Cap Index fund just to match the performance of the index fund. The Vanguard Mid Cap Index fund charges an expense ratio of 0.05%.
Check the R-squared value of an active fund against that of a peer index fund. If the two are close—say within a couple of percentage points of each other—it suggests the active fund is charging a premium for an index-fund-like return. If you are going to pay extra for a fund, you want a manager who has shown the ability to both be different than the index and realize higher long-term returns.
Portfolio composition also matters. More concentrated portfolios imply that the fund manager is taking bigger bets on a relatively small number of securities. This can lead to a higher category risk index and potentially more volatility.
The year-by-year returns of leveraged, inverse and niche funds should always be checked. Very strong short-term returns may have been preceded by steep prior-year drops. Similarly, funds targeting specific industries or themes have the potential to be highly volatile. Such funds typically are introduced as ETFs. Investors should realize that their limited history and narrow focus makes these funds very speculative.
Returns provide a track record to gauge the performance of long-tenured fund managers. Such managers are mostly found among mutual funds; only a relatively small number of active ETFs currently exist. We have been seeing a broader trend toward management by committees over the past several years, which lessens the need to put an asterisk by historical returns when a single manager leaves a fund.
Less importance can be placed on the historical returns of broad-based index funds—though you should still check them. The performance of the underlying index is the main driver of returns for such funds. But expense ratios do matter, as some index funds are cheaper than others.
Be careful not to judge an index fund by its name alone. You need to pay attention to which index the fund is following. If it is not a broad-based index (e.g., S&P 500, Russell 2000, etc.), then apply the same level of scrutiny to the fund as you would to an actively managed fund. You will likely pay relatively more than you would for a plain-vanilla fund (even among ETFs), so you want to ensure you’ll be compensated for opting for a different index.
PRISM Wealth-Building Process

AAII How-To

Mutual Funds

BARRY J from TX posted over 4 years ago:
CHARLES B from CO posted over 3 years ago:
You need to log in as a registered AAII user before commenting.
Log InCreate an account