


Related

Mutual Funds
How to conduct a head-to-head comparison of two mutual funds, taking into consideration the relationship between risk and return and the impact of costs and taxes on your realized returns.
by John Bajkowski | June 2020

When it comes to examining your mutual funds and exchange-traded funds (ETFs), it is all relative. Funds offer an attractive way to hold a diversified portfolio that is managed professionally at very little cost, but you still need to do your homework when selecting and managing your holdings.
The process of selecting a fund or evaluating your current holdings really begins with your portfolio objective and asset allocation. AAII members have access to the Lifetime Investment Strategy guide and Asset Allocation Models to help determine your desired portfolio segments.
It’s natural to seek the best-performing investments, but you must consider the relationship between risk and return and the impact of costs and taxes on your realized returns.
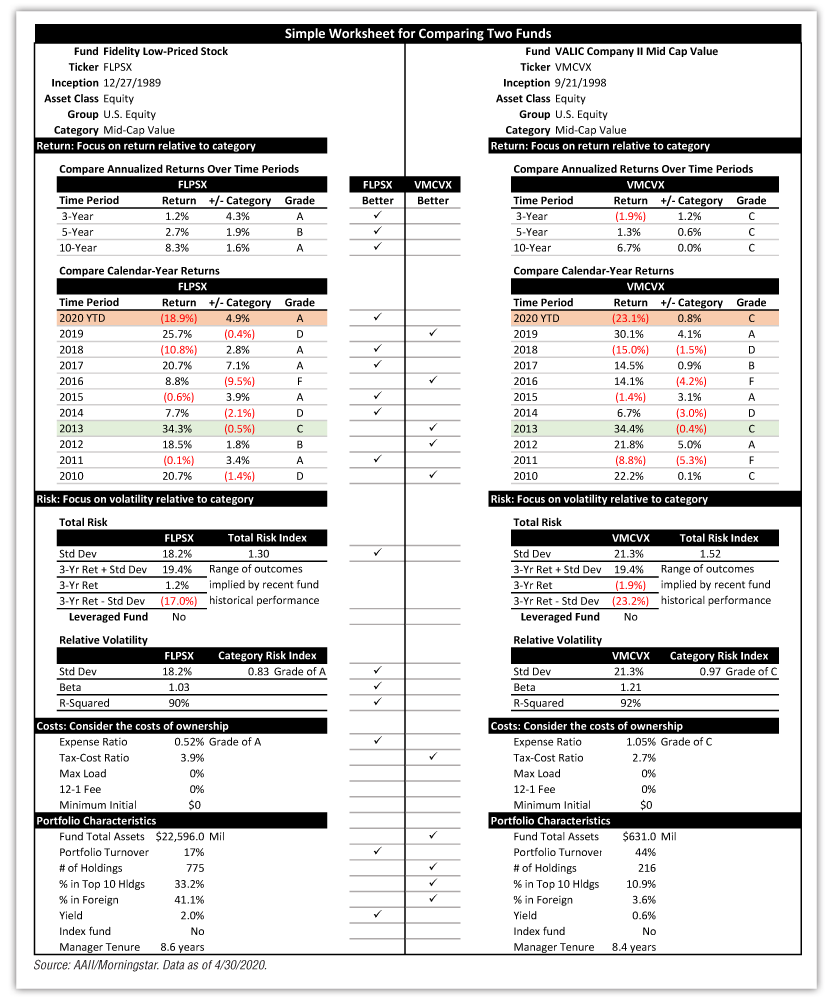
For the fund evaluation here, we are comparing two funds: Fidelity Low-Priced Stock  (FLPSX) and VALIC Company II Mid Cap Value (VMCVX). Both are classified as U.S. equity, mid-cap value funds. The Fidelity fund was started at the end of 1989; the VALIC fund in September of 1998. This example is not intended to recommend either fund but rather to demonstrate the process for comparing.
Lists of top-performing funds over the last year make good headlines but are not the best place to get investment ideas. These lists of top-performing funds help to reveal the asset segments and sectors that have been in favor recently, and you must ask yourself if the conditions that led to their strong performance will continue forward or if some rotation will occur. It is better to compare funds in the same category, looking at relative performance of annualized returns over different periods as well as individual calendar-year returns that encompass different market conditions.
The first return block examines the return over the last three-, five- and 10-year periods. The column labeled “Return” lists the annualized total return of the fund. The “+/- Category” column is the difference in return between the fund and the average return for all funds in the same category. When the difference is negative, the fund underperformed the average fund in its investment category for the period indicated. For example, the VALIC fund had a negative total return of 1.9% over the last three trailing years for the period ending April 30, 2020, but it actually outperformed the average mid-cap value fund by 1.2 percentage points. Note that you may see some display rounding errors as the numbers and calculations are stored in a greater precision than shown in the forms. The letter grades of A, B, C, D and F are based upon relative rankings within the investment category. A grade of A for example, would indicate that the return is in the highest 20% for that time period of all funds in that category.
The second return block examines the last 10 complete calendar-year returns along with the current year-to-date performance. The green bar highlights the strongest year, while the red bar indicates the weakest year. It helps to look at the unusually good or bad years. The Fidelity fund looks to suffer less in weak years, but the VALIC fund generally performs relatively more strongly in up years.
A basic investment concept is that risk should be rewarded. Standard deviation measures the degree of variation in return experienced relative to the average return for a fund. It notes the recent volatility of the fund but does not explain the elements impacting the volatility. For example, portfolio concentration or exposure to foreign investments can impact the volatility and should be examined to gain an understanding of the fund.
The total risk index relates the volatility of the fund to the volatility of all funds. It can help you understand the volatility of a fund across all categories. Ratios above 1.00 indicate higher risk than average. The category risk index relates the volatility of a fund to the average volatility for funds in the same investment category. Letter grades of A, B, C, D and F are based upon these relative rankings. The beta is a risk measure that relates the fund’s volatility of returns to the market. The higher the beta of a fund, the higher the market risk of the fund. The R-squared indicates what percentage of the return is explained by the market. The Fidelity fund is less volatile but has greater concentration in its top holdings and greater exposure to foreign stocks.
There are four basic costs that end up reducing overall returns to investors. The first is the sales charge or load, which is usually taken out of the investor’s initial investment or final amount received on sale but may also take the form of annual charge against assets. The second includes redemption fees and charges for investing or switching funds. The third type of cost is fund expenses, such as an adviser’s fees and fees for the transfer agent and custodial services. The fourth type of cost is the brokerage cost incurred when trading. Neither fund charges any load or redemption fee, however the VALIC fund has a significantly higher expense ratio. The higher yield of the Fidelity fund helped to contribute to a greater tax-cost ratio.
Assets under management may help spread the costs of managing the fund, but it may also hinder the flexibility of the portfolio manager. Fund size is a greater concern for actively managed funds investing in smaller companies than for index funds. ?
Mutual Funds

Mutual Funds


Thomas S from OH posted over 6 years ago:
GARY F from NM posted over 6 years ago:
Andrew G from CA posted over 6 years ago:
JOHN L from TX posted over 6 years ago:
ROBERT W from CA posted over 6 years ago:
STEPHAN J from IA posted over 6 years ago:
You need to log in as a registered AAII user before commenting.
Log InCreate an account