

Related

Dispatches
Market breadth is often used by fundamental investors to help determine the most opportune time to execute a trade once a decision to buy or sell has already been made.

The movements of the major market indexes make headlines at the close of each trading day. But while the S&P 500 index, the Nasdaq composite and the Dow Jones industrial average normally encapsulate the news of the markets for the day in headlines, they do not represent the entirety of publicly traded U.S. stocks. As such, they don’t always account for how the market is moving.
Market breadth, or the breadth of the market, is the percentage of stocks rising or falling in price. Analysts report good breadth if two-thirds of the stocks listed on an exchange rose during a trading session. A market trend with good breadth is more significant and probably more long-lasting than one with limited breadth, since more investors are participating.
There are a variety of market breadth measurements. Technical analysts track market breadth for discernible patterns that can help inform their investment decisions. Market breadth is often used by fundamental investors to help determine the most opportune time to execute a trade once a decision to buy or sell has already been made.
Measures of market breadth can signal changes in investor sentiment that indicate potential market movements underway or that may be forthcoming. An ability to read market breadth may help lead to a more favorable transaction price. Like any timing indicator, there is never a guarantee of market breadth signaling a better price to trade at—only more favorable potential odds.
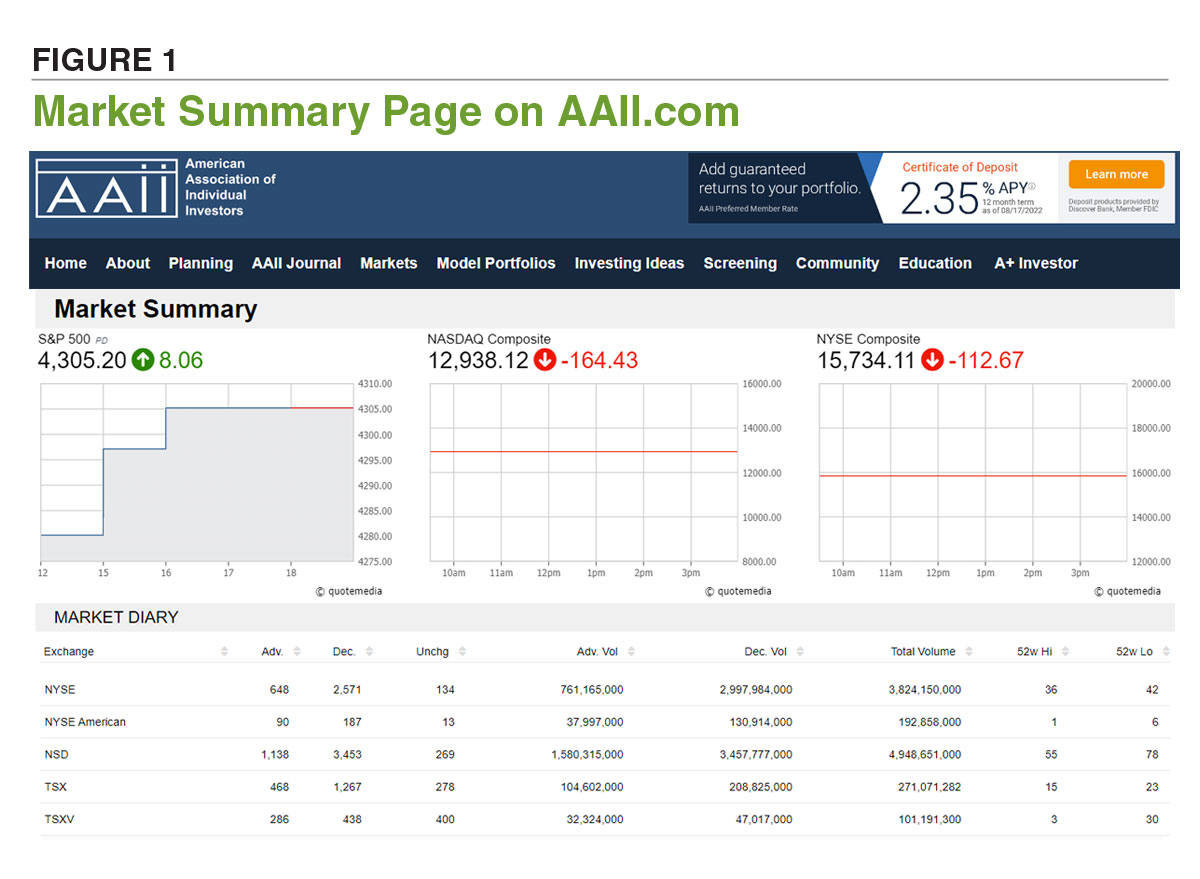
The most common market breadth measurements track the number of stocks advancing in price for a given day against the number of stocks declining in price—numbers that are finalized when the exchange ceases trading for the day. The number of stocks with neutral price changes is also tracked.
Market breadth statistics are available at the Market Summary page on AAII.com (Figure 1).
The advancing issues and declining issues for a day are used to calculate the advance/decline line, the simplest of all market breadth measures. The number of declining issues is subtracted from the number of advancing issues. This number is often added to the previous advance/decline value to provide a visualization of the trend. The difference between advancing issues and declining issues could also be plotted by itself, but the cumulative line is smoother and thus easier to read.
When more stocks are advancing than declining, the advance/decline line moves up, while a majority of issues declining pushes the line downward. Whether the advance/decline line is rising or falling provides an indication of the market’s overall strength.
When comparing the movement of a market index to that of the cumulative advance/decline line, investors should take note when divergences between the two develop—say, when the index is declining while the advance/decline line is rising, or vice versa.
Advancing issues and declining issues can also be calculated as a ratio. When the ratio is high, the market has been trending higher, while a low ratio indicates a downward trend.
The advance/decline ratio is also referred to as the overbought/oversold ratio. The advance/decline ratio will always be positive because it is dividing the advancing issues by the declining issues. A ratio above 1.0 indicates more advancing issues than declining issues and a ratio less than 1.0 indicates more issues declining than advancing. (The advance/decline line, which subtracts decliners from advancers, can be negative.)
When the advance/decline ratio is at extreme highs or lows, it is more likely to indicate a market that is overbought or oversold, respectively.
The unchanged issues index is calculated by dividing the number of unchanged issues by the total number of issues traded. This ratio, usually expressed as a percentage, is used by some technicians to help gauge whether the market is at a transition point.
In general, the ratio is low when the market is moving strongly—either up or down—but comparatively high during periods of consolidation or congestion, when the number of unchanged issues tends to rise.
In addition to the number of advancing and declining issues, AAII’s Market Summary page provides the trading day’s volume. Volume is the total number of shares traded in a particular period. Volume figures are reported daily by exchanges for both individual issues traded and for the total amount of trades executed on the exchange. AAII’s Market Summary page has a section called Market Movers, where you can see a sample of the most active stocks on the three major exchanges.
Technical analysts place great emphasis on the amount of volume that occurs in the trading of a particular security. This emphasis also applies to the market. Share prices that are rising or falling are more meaningful if volume is also high. When volume is low, trading is thin, and buy/sell decisions can move the market disproportionately.
This is of particular note for stock strategies that pursue small-cap or micro-cap stocks, which are usually out of the mainstream spotlight. Low volume makes it harder to move in or out of a position at a reasonable, desired price since there are fewer sellers or buyers.
You can also compare the volume of stocks that have advanced in price (advancing volume) to that of stocks that have declined in price (declining volume). Advancing volume would be expected to surpass declining volume during market uptrends and lag during periods of market decline.
Breaking total volume into advancing volume and declining volume adds a greater understanding to market movement. Volume that does not confirm the overall trend in the market—divergence—typically indicates that the index will reverse to match the trend in volume.
The upside-downside (volume) ratio is calculated by dividing the advancing volume by the declining volume. When the ratio is above 1.0, the trading volume in stocks that are rising in price is outpacing the volume in stocks whose prices are falling. As the ratio approaches 0.0, the volume of declining issues is far outweighing the volume of advancing stocks.
AAII’s Market Summary page also displays the number of stocks reaching a 52-week high or low. Increasing numbers of stocks reaching new highs coupled with fewer stocks reaching new lows is generally representative of bull markets, and the reverse is true in bear markets.
As with advancing issues and declining issues, the number of new lows can be subtracted from the number of new highs and plotted for each day over time, which may indicate trends. In general, this new high/new low oscillator reaches extreme lows just ahead of a major market bottom. As the market turns up from the major bottom, the indicator will rapidly rise in value; many new stocks make new highs because it is easier to make a new high when prices have been at depressed levels for an extended period.
Over time, a divergence may develop as fewer stocks are reaching new highs, i.e., the indicator value falls, while indexes continue to make new highs. This bearish divergence is often a signal that the current uptrend in the markets is weak and may reverse.
There is more to gauging the movement and strength of the market than just following the daily change in the major market indexes. Short-term trading indicators provide a quick snapshot of market conditions at any point in time during market trading hours and at the close.
For individual investors, market breadth can help indicate whether it is a good or bad time to execute a trade, as long as it isn’t necessary to make the trade in the moment. With observance and patience, market breadth provides another set of tools to gauge the market’s sentiment and help you execute more efficient trades.
AAII launched a Sentiment Investing Dashboard to help you interpret and apply sentiment indicators. In addition to market breadth measures, it includes 10+ indicators measuring investor sentiment and market sentiment, valuation, trend and volatility. Find out more at the AAII Sentiment Investing site
Dispatches
Trading Strategies


ROBERT A from NC posted over 4 years ago:
You need to log in as a registered AAII user before commenting.
Log InCreate an account