


A study tested Warren Buffett’s belief that looking at the value of the equity market relative to the gross domestic product (GDP) could be a good predictor of stock market mispricings.
Researchers analyzed Buffett’s theory on international stock markets using the ratio of the market value of equity scaled by GDP, or MVE/GDP. The study covered 37 democratic countries with market-based economies, using quarterly data available for market capitalization and GDP starting in 1985. The researchers set up trading rules to backtest the MVE/GDP indicator in a practical environment and determine how the highest model-predicted returns performed compared to a buy-and-hold strategy. They used a 10-year horizon to forecast equity returns.
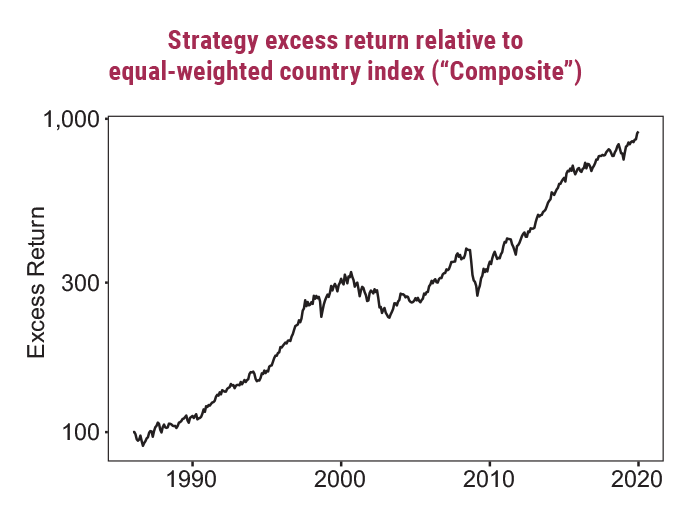
The study found that from 1985 to 2019, a composite average of 10 strategies returned 10.5%, on average, compared to the benchmark performance of 9.5% for the S&P 500 index. Additionally, the outperformance was accompanied by lower volatility (13.6% vs. 14.2%), a superior Sharpe ratio (0.57 vs. 0.49) and a reduction in maximum drawdown. The results also showed that the MVE/GDP ratio explains 83% of overall return variation, ranging from 42% for Austria to 94% for Great Britain.
The study results show that the MVE/GDP ratio possesses statistically significant forecast properties for long-term equity returns. The Buffett Indicator can thus be viewed as a yardstick for investor sentiment toward stock markets and, by logical extension, toward financial assets in general.
The analysis conducted in the study demonstrated that the market value of equity relative to GDP provides a useful tool for investors.
Source: “The Buffett Indicator: International Evidence,” by Laurens Swinkels and Thomas S. Umlauft; SSRN, March 30, 2022.


Discussion
FREE REPORT

Get your free copy of our special
report analyzing the tech stocks
most likely to outperform the
market.
JOHN L from NJ posted over 2 years ago:
FERNANDO R from FL posted over 2 years ago:
ROBERT A from NC posted over 2 years ago:
FERNANDO R from FL posted over 2 years ago:
CHUCK M from GA posted over 2 years ago:
You need to log in as a registered AAII user before commenting.
Log InCreate an account