

Related

Financial Statements
Useful metrics found on a stock's Evaluator Snapshot page at AAII.com and how they help determine if a stock deserves a closer look.

Charles Rotblut leads a class in AAII's new Essential Investing Video Course. Go to https://www.aaii.com/ves for more information and to subscribe.
AAII’s Stock Evaluator Snapshot gives you an overview of how attractive (or unattractive) a stock is. With a quick glance, you can assess the company’s profitability, growth, valuation, earnings expectations, fundamental strength and size.
In this month’s How-To, I highlight and explain several useful metrics you will find on the Evaluator Snapshot page. You learn how to use them to determine if a stock deserves a closer look or should be passed on.
The Snapshot page is accessible by all AAII members. To get to the page, type a stock’s name or ticker symbol in the Search box at the top of AAII.com and select the company from the menu. The Snapshot is the default page you land on; scroll down to the Financial Summary section on this page to see the common metrics.
Net income and operating cash flow are useful numbers to start your stock analysis with. Both are presented on a trailing 12-month (TTM) basis in the Financials section of the Snapshot page (Figure 1).

Net income is a company’s profit or loss after all expenses and taxes. Earnings per share (EPS), which is located right below net income, shows profits or losses on a per-share basis.
Operating cash flow is the amount of cash generated from normal business operations. The indirect method—used by publicly traded corporations—starts with net income and adds back noncash expenses. It then further adjusts net income for nonoperating income, nonoperating expenses and balance sheet changes attributable to operating activities.
Both are important for different reasons. Income, particularly earnings per share, is used in valuation ratios. Income is based on accrual accounting, which recognizes transactions when their economic benefits become probable. Cash flow tracks the timing of when cash goes into and out of the company. Cash is necessary to pay salaries, pay dividends, repurchase shares and fund business operations. Net income and operating cash flow should routinely be positive.
Five-year annualized growth figures are provided for sales, income, dividends and cash flow in the Growth section of the Snapshot page. The longer time period provides a broader view of a company’s trends. It helps to smooth the impact of a single good or bad year.
These numbers should generally be positive.
Negative sales, net income and earnings per share numbers for a company may not necessarily signal a company-specific problem if the industry median is also negative. A negative industry median can imply that the industry is incurring a slump. Additional research is needed to determine if the slump is caused by a typical business/economic cycle or something more concerning (e.g., technological obsolescence, a lasting shift in consumer preferences, etc.).
We prefer to see five-year dividend growth above the rate of inflation. A negative number for dividend growth is worrisome because it signals that a cut has been made. Stocks of companies that cut their dividends have historically tended to underperform.
Cash flow growth not only includes cash from operations but also cash from investing and cash from financing. This number requires more analysis. Growth should be attributable to higher operating income and not capital raised through the issuance of stock. Declining cash flow may reflect worsening business conditions or be attributable to investments in the business, paying down debt and/or share repurchases.
Valuation ratios tie a company’s market value to its fundamentals. Stocks with lower (cheaper) valuations have outperformed over the long term. High valuations signal greater expectations for future growth; those expectations are not always met.
The Valuation section of the Snapshot page presents key valuation ratios. The most commonly used valuation metric is the price-earnings (P/E) ratio. It divides a stock’s price by the company’s trailing 12-month earnings per share. The price-earnings ratio is often referred to as a multiple because it shows how many times one year’s worth of earnings a stock is trading at.
The price-to-book-value (P/B) ratio compares a stock’s price to its book value per share. Book value is total assets minus total liabilities. The price-to-book ratio has long been used by value investors. AAII’s Model Shadow Stock Portfolio uses the price-to-book ratio as one of its key criteria.
The five-year price-earnings-to-earnings-growth (PEG) ratio compares the current price-earnings ratio to the five-year historical growth rate in earnings. It shows whether the valuation (price) of the stock reflects trailing 12-month earnings and the five-year growth rate in earnings. As a rule of thumb, a stock with a PEG ratio of 1.0 is priced fairly. PEG ratios below 1.0 imply undervaluation given growth, while ratios above 1.0 suggest overvaluation.
The industry medians are shown to enable you to compare a stock’s valuations to its industry peers. Higher valuation ratios relative to industry peers can be justified if the company holds competitive advantages within its industry or is better managed.
Ratios make it easier to analyze a company based on its fundamental characteristics and to compare it against its peers or other companies.
Two figures shown in the Ratios section of the Snapshot tab measure profitability: gross margin and net margin. They show the percentage of revenue a company has maintained after accounting for cost of goods sold (gross margin) and after all expenses have been accounted for (net margin). Numbers above the industry median are preferable.
Return on assets (ROA) and return on equity (ROE) analyze efficiency. They measure how much profit a company generates off of its assets and equity. Again, numbers above the industry median are preferable.
The liabilities-to-assets ratio shows proportionately how much a company has in total liabilities relative to its total assets. This ratio should be below 100%. A number that is much higher than the industry median signals a greater reliance on debt financing.
Financial ratios are discussed in depth in this month’s issue article “18 Financial Ratios That Shed Light on a Company’s Strengths and Weaknesses”.
Earnings estimates are the average of profit forecasts made by covering analysts. Companies that are more widely followed will have more analysts publishing estimates, while companies that are less widely followed will have fewer analysts making forecasts. This is shown as # of Estimates in the Estimates section of the Snapshot page (Figure 2).
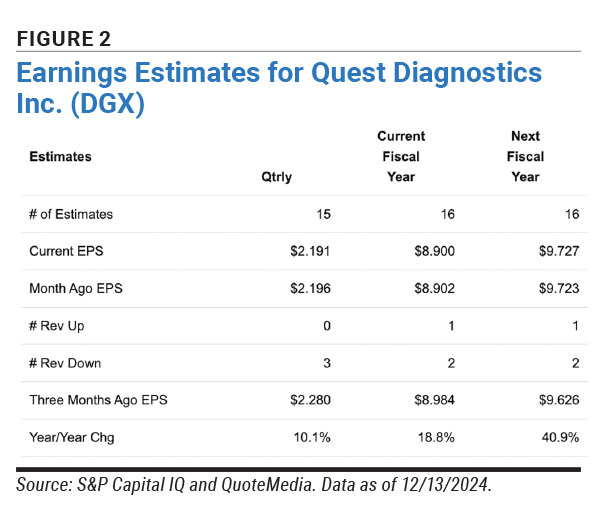
Earnings estimates for the next fiscal year that are larger than those for the current year signal expected growth. The Qtrly column reflects expectations for the current quarter. Those expectations should be compared against the reported earnings for the same quarter one year ago.
Revisions are a powerful way to analyze estimates. The current earnings estimate should ideally be above the month-ago and three-months-ago consensus estimates. Revisions are most frequently made right after a company announces earnings, as this is when updated guidance is typically issued by the company. The number of analysts that revised their earnings estimate is shown as # Rev up and # Rev down.
The market capitalization numbers tell you how large or small a company is. You can look at the industry median to tell if a company is larger or smaller than its industry peers.
The float is the number of freely tradable shares in the hands of the public. This figure, when combined with average daily volume (ADV), tells you how easy it is to trade the stock. The larger the numbers, the easier it generally is to buy and sell shares of the stock. The stock’s price should also be considered since a low-price stock can have lots of shares sold on an absolute basis but with a small overall dollar volume.
Though each of these metrics provide insights about a stock’s attractiveness, developing a thorough opinion starts with looking at all of them. By doing so, you’ll determine whether a company is profitable, growing, attractively valued, efficiently managed and expected to earn more than analysts previously thought.
Financial Statements

AAII Stock Ideas

AAII Stock Ideas

BARRY J from TX posted over 1 year ago:
MARK E from IA posted over 1 year ago:
CHARLES R from IL posted over 1 year ago:
You need to log in as a registered AAII user before commenting.
Log InCreate an account