


Related

Financial Statements
Financial ratios provide a powerful framework for assessing a company’s performance, efficiency and financial health across multiple dimensions and over time.

Charles Rotblut leads a class in AAII's new Essential Investing Video Course. Go to https://www.aaii.com/ves for more information and to subscribe.
Financial ratios simplify the process of conducting fundamental analysis on a company. These metrics provide clear, actionable insights derived from the three primary financial statements: the balance sheet, income statement and cash flow statement.
In this installment of our financial statement analysis series, I share 18 key financial ratios that can help you assess a company’s financial attractiveness and compare its performance against industry peers, using Alphabet Inc.  (GOOGL) as an example. Table 1 shows the formulas for each ratio and the resulting calculations for Alphabet based on its 2023 financial statements.
The data used in this example comes from Alphabet Inc.’s (GOOGL) 2023 income statement, balance sheet and cash flow statement. These financial statements can be found in the Financial Statement Analysis articles in the March, May and September 2024 issues of the AAII Journal. Additional data was pulled from AAII’s Stock Investor Pro database and stock screening program.
Dollar amounts are in millions.
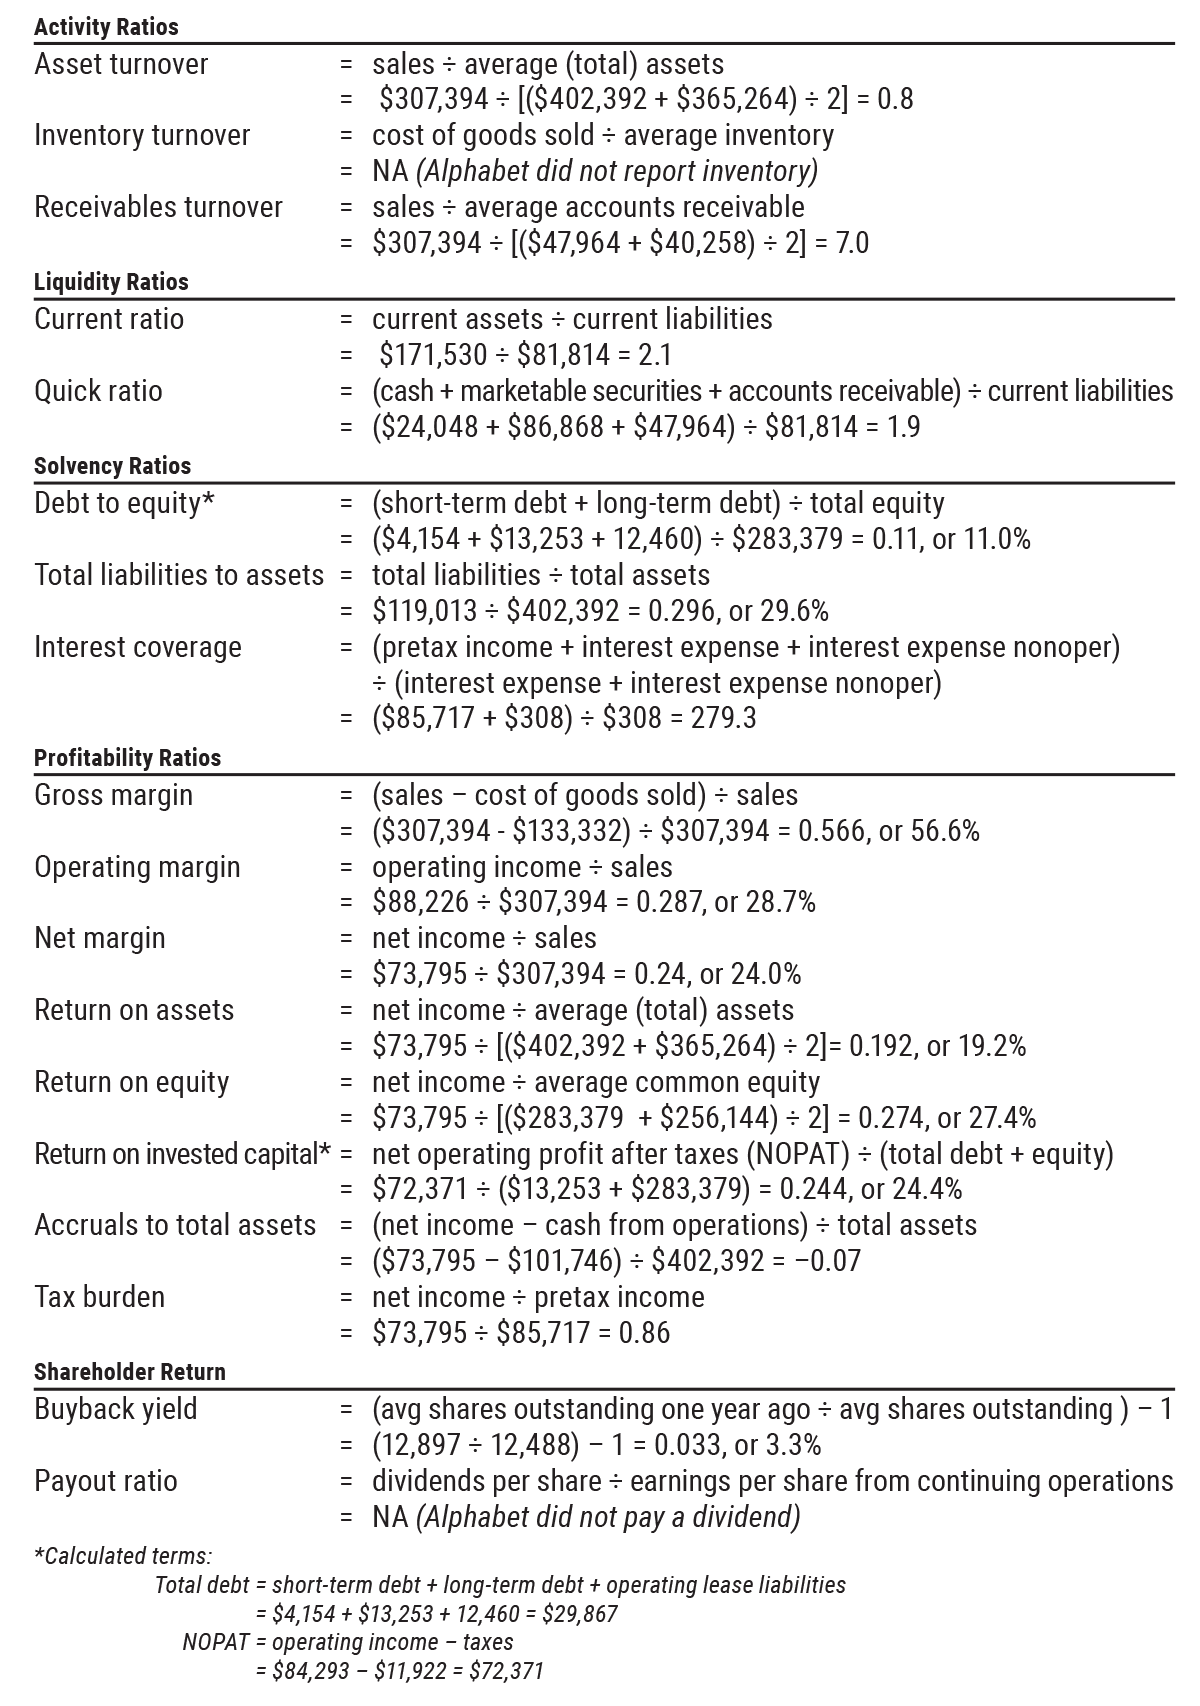
Activity ratios are used to measure how efficiently a company utilizes its assets. The ratios provide investors with insights about the efficiency with which a company operates.
All three activity ratios are “turnover” ratios. They measure how quickly or slowly a company turns over its assets. In other words, they present how many times per year inventory is replenished or receivables are collected.
Each activity ratio relates an income statement line item to a balance sheet line item. Income statements report the sum of transactions for fiscal quarters and years. Balance sheets report assets, liabilities and equity as of a single day. Activity ratios account for this difference by calculating average values for assets, accounts receivable and inventory based on beginning and ending reported numbers for the specified period (quarter or year).
The asset turnover ratio evaluates how effectively a company realizes revenues from its assets. The ratio is calculated by dividing net revenues by average total assets. The denominator in this ratio is total assets for the latest fiscal period plus total assets for the preceding fiscal period divided by two.
A relatively low asset turnover ratio can suggest inefficiencies in asset utilization or be reflective of a capital-intensive business model. It may also signal a deliberate strategic decision by management to prioritize a more asset-heavy approach over a labor-intensive one. When analyzing this metric, it’s important to consider the industry that the company operates in as well as its business strategy. Alphabet’s $111 billion in cash and short-term investments caused it to have the same asset turnover ratio (0.8) as capital-intensive Caterpillar Inc. (CAT) at the end of 2023.
Inventory turnover is cost of goods sold (COGS) divided by average inventory. The higher the ratio, the faster inventory is sold. Higher ratios generally signal better management of inventory levels. High ratios can also signal issues such as too little inventory, difficulties with replenishing key items and/or a failure to keep up with demand.
Inventory levels and turnover are specific to the industry and even the company. Seek out higher relative inventory turnover ratios for companies holding inventory with short product life cycles (e.g., fast-fashion retailers, technology companies, etc.).
Alphabet does not break out its inventory as a separate line item on its balance sheet, so we cannot calculate the ratio. If it did, we would calculate the ratio for the company’s 2023 calendar year by dividing its $133.3 billion in cost of goods sold by the average of reported inventory on December 31, 2023, and December 31, 2022.
The lack of reported inventory reflects Google’s reliance on online advertising for the bulk of its revenues. These digital revenue sources allow Google to maintain a low level of inventory relative to its revenues.
The receivables turnover ratio, calculated by dividing net revenue by average receivables, measures how effectively a company collects payments owed by its customers. It provides insight into how many times per period the company converts its receivables into cash.
In Table 1, the receivables turnover is 7.0x, indicating that, on average, Alphabet fully collected its receivables 7.0 times during all 2023. This equates to approximately once every 52 days (365 ÷ 7.0).
A higher-than-industry-average ratio can suggest that the company is more efficient in collecting receivables, providing funds for operations. However, this metric should be assessed in the context of the industry. An excessively high turnover ratio could indicate an overly strict credit policy, potentially limiting sales opportunities. On the other hand, a low or declining turnover ratio may raise red flags about customers’ ability to pay or inefficiencies in the company’s collection processes.
Liquidity ratios assess a company’s ability to meet its short-term obligations. This makes them among the most frequently used financial metrics. Creditors and fixed-income analysts pay particular attention to liquidity ratios.
Liquidity requirements vary significantly by industry. For example, grocery and warehouse stores replenish their inventories frequently. Software companies tend to have fewer immediate cash demands. As a result, comparing liquidity ratios across industries can be misleading.
It’s equally important to monitor a company’s liquidity trends over time. Consistent improvements or declines can signal shifts in operational efficiency or financial health, helping investors and creditors identify potential opportunities or red flags.
The current ratio measures a company’s ability to cover its short-term liabilities with its current assets. This makes it a useful indicator of a company’s short-term financial health. The current ratio is calculated by dividing current assets by current liabilities.
Current assets, found at the top of the balance sheet, include items such as cash and cash equivalents, accounts receivable and inventory. Current liabilities include accounts payable and short-term debt.
A simple way to judge the ratio is to see if it is above or below 1.00. Ratios below 1.00 signal that the reported total value of a company’s current assets is not large enough to fully cover its current liabilities. Alphabet’s current ratio of 2.1 is strong, as it shows the company’s current assets being nearly double current liabilities.
Though high current ratios signal a large cushion, they can also raise concerns. Too much held in current assets may signal an overly conservative cash reserve, excessive inventory or even rising accounts receivable due to lax collection practices. While these issues are unlikely to threaten the company’s solvency, they can weigh on profitability over time.
The quick ratio is a stricter measure of liquidity than the current ratio. It evaluates the company’s ability to meet its current liabilities using only its most liquid assets: cash, short-term marketable securities and accounts receivable. These assets are viewed as being immediately available for spending or able to be quickly converted into cash at or near reported values.
Less liquid current assets, such as prepaid expenses and inventory, are excluded. Prepaid expenses may not be fully recoverable. Similarly, inventory may be difficult to sell during periods of economic stress or when the company’s industry is experiencing a downturn. Additionally, if a company’s inventory is highly specialized or nearing obsolescence, its value to potential buyers may be significantly reduced.
Alphabet’s quick ratio of 1.9 is close to its current ratio. Again, the company’s large cash and marketable securities balances are attributable. Alphabet’s inventory—which is grouped in with other current assets as previously noted—represents just a small portion of its total current assets.
Solvency ratios assess a company’s ability to meet its long-term obligations, providing insight into its capital structure and the extent of financial leverage it employs. These financial ratios help investors determine how sustainable a company’s level of debt is and whether it can easily meet its financial commitments.
Certain solvency ratios focus on whether a company generates sufficient cash flows to cover fixed obligations, such as interest payments. Others look at the proportionate level of debt. Carrying too much debt can increase a company’s risk of insolvency, limit its ability to expand and/or prevent it from paying dividends.
The debt-to-equity ratio shows how much short- and long-term debt a company has relative to its equity. A ratio of 1.00x signifies that the firm relies equally on debt and equity for capital. Put another away, debtholders have as much claim to the company’s assets as shareholders do. Shareholders would therefore end up with nothing in a hypothetical liquidation scenario since creditors are paid first in such scenarios.
Total debt in the numerator includes both short- and long-term interest-bearing obligations. Alternatively, the ratio can be recalculated using only long-term debt (long-term debt to equity), providing a more focused view of the company’s reliance on long-term financing. Capital-intensive companies tend to have higher debt-to-equity ratios relative to companies that require less in terms of manufacturing plants, machinery and other fixed assets.
The total-liabilities-to-total-assets ratio is more comprehensive than the debt-to-equity ratio. It shows whether a company’s total liabilities are below, equal to or greater than total assets. The ratio is calculated by dividing total liabilities by total assets.
Ratios below 1.0x signal that liabilities are less than assets. Ratios above 1.0x signal that liabilities exceed assets. When total liabilities exceed total assets, there is no equity for shareholders to lay claim to on a reported basis. Shareholders still retain their voting power, however.
High total-liabilities-to-total-assets ratios may signal potential solvency issues if the company struggles to meet its obligations. Meanwhile, a low ratio may suggest the company has more flexibility to take on additional financing if needed. It can be helpful to look at the trends in the ratio. The total-liabilities-to-total-assets ratio can be temporarily pushed higher if a company uses debt financing to expand its facilities, acquire a competitor and/or repurchase stock.
The interest coverage ratio (aka times interest earned) measures to the extent to which a company can meet its interest payment obligations with pretax earnings. It is calculated by dividing earnings before interest and taxes (EBIT) by the reported interest expense. Higher ratios reflect a lower risk of a company failing to meet its debt obligations.
Alphabet’s interest coverage ratio was extremely high at 279.3 at the end of 2023. This is due to the low level of debt the company carries. In contrast, the median interest coverage ratio for exchange-traded companies was 0.7.
It’s important to evaluate interest coverage ratios across both periods of expansion and contraction. Many companies demonstrate solid coverage during periods of economic growth, but their ability to meet interest payment obligations may decline sharply during downturns.
Profitability ratios are the most used financial ratios in investment analysis. These include key “margin” ratios—gross, operating and net profit margins—which evaluate the firm’s efficiency in turning revenues into profits at various levels of operation.
When analyzing a company’s margins, it is crucial to compare them with those of the industry and its closest competitors. Margins can vary widely depending on the sector and industry. For example, industries dominated by companies selling similar products with little to differentiate their offerings tend to be less profitable. Conversely, companies that offer unique products or services—particularly those with recurring demand and significant barriers to entry—tend to have higher margins.
Other profitability ratios analyze how efficient a company is at realizing income, as well as the sustainability of its earnings and tax management practices.
Profit margin ratios—gross, operating and net—show a company’s profitability at different stages of its operations. Together, they provide a comprehensive view of how effectively a firm converts revenue into profit.
Gross margin reflects how much of a company’s revenue remains after covering cost of goods sold or cost of sales. The higher the gross margin, the greater the ability for the company to charge prices above the cost of the products and services it offers.
Competitive pressures, customer price sensitivity, technological obsolescence or better innovation from rivals can drive gross margins down. Higher-than-average gross margins often signal competitive advantages like superior product quality, strong branding, operational efficiencies or scarcity.
Operating margin measures profitability after adding operating (“overhead”) expenses to cost of goods sold. Alphabet’s gross profit margin is 56.6%, but its operating profit margin is 28.7% because of the additional expenses factored in. The company’s operating profit margin shows that it retains $0.287 for every dollar of revenue at the operating level.
Executives have more control over operating costs than they do over the cost of goods and services. The operating profit margin therefore shows how efficiently management is running the company. Changes in the ratio need to be taken in context with any fluctuations in the gross profit margin.
Net profit margin reflects the company’s overall ability to manage all expenses, including interest and taxes, to generate profit. It represents the “bottom line” and offers insights into how well the company turns revenue into earnings for shareholders.
Analyzing all three margins together and tracking them over time is essential. Fluctuations may align with business cycles, but consistent narrowing (declining) margins can signal business challenges. Widening (rising) margins typically indicate improving performance and profitability.
These next financial ratios show how effective a company is at using its assets and capital structure to realize income.
Return on assets (ROA) is calculated by dividing net income by total assets. It measures how efficiently a firm utilizes its assets to generate earnings. Alphabet’s return on assets of 19.2% ranks among the highest of all exchange-listed companies.
Return on equity (ROE) measures net income against total average stockholder’s equity. It shows the percentage profit earned relative to shareholder’s interest in the company. Return on equity is impacted by a company’s use of financial leverage, which can significantly inflate or deflate it. Significant discrepancies between return on assets and return on equity often signal heavy reliance on debt.
Return on invested capital (ROIC) complements these ratios by assessing how effectively a company uses its total invested capital (debt and equity). Return on invested capital differs from return on assets and return on equity by using net operating profit after taxes (NOPAT) in the denominator instead of net income. NOPAT is operating income less taxes. NOPAT also does not consider interest expense. Strong return on invested capital values can indicate prudent capital management and a competitive edge.
The accruals-to-total-assets ratio evaluates the sustainability of a company’s earnings. It is calculated by taking the difference between net income and cash from operations over the last 12 months, then dividing that difference by total assets for the most recent quarter.
This metric highlights the impact of accrual accounting. Accrual accounting records transactions when their economic benefits become probable instead of when cash is exchanged. Situations where net income significantly exceeds cash from operating activities may indicate that earnings are less sustainable and more susceptible to future write-downs or adjustments.
By scaling accruals to total assets, this financial ratio provides a standardized measure that enables comparisons across companies. Such comparisons offer insight into which firms are generating higher-quality, cash-backed earnings.
The tax burden ratio measures the percentage of a company’s income that remains after accounting for taxes. It is calculated by dividing net income by pretax income. (This ratio is the inverse of the tax retention rate, which is used in the DuPont formula for analyzing return on equity by its underlying components.) A higher tax burden ratio indicates that a company retains a greater percentage of its earnings after taxes, signaling effective tax management or the benefit of favorable tax policies.
The tax burden ratio impacts both return on assets and return on equity. A higher rate of retention increases return on assets and return on equity, while a lower rate of retention reduces those ratios.
Shareholder return metrics measure the extent to which a company uses its capital allocation to reward shareholders. These metrics show how a company balances returning capital to shareholders with retaining profits and cash flow.
The buyback yield is the change in average shares outstanding. Specifically, it compares the average shares outstanding for the latest fiscal quarter (Q1) to the average shares outstanding in the same fiscal quarter one year ago (Q5).
The buyback yield can be positive or negative. A positive number signals a net reduction in the number of shares outstanding. A negative number signals that there are now more shares outstanding than there were one year ago. A large negative buyback yield typically suggests the issuance of new shares to raise capital.
The payout ratio is the proportion of a company’s earnings paid out as dividends to shareholders. It is calculated by dividing dividends per share by earnings per share from continuing operations.
Payout ratios near or above 100% are not sustainable for most companies. Lower payout ratios provide companies with more flexibility to raise their dividends.
Financial ratio analysis provides a powerful framework for assessing a company’s performance, efficiency and financial health across multiple dimensions and over time. These ratios also enable comparisons between two or more companies. They help investors identify which is more attractive in terms of financial strength, profitability and shareholder friendliness.
When conducting financial ratio analysis, compare companies within the same industry or sector since margins, profitability and capital structures can vary significantly across different industries and sectors.
Our next financial statement analysis article on red flags to watch for will appear in the April 2025 AAII Journal. All articles in this series can be accessed at AAII.com in the AAII Journal article index.
Financial Statements

Financial Statements

Financial Statements

R W from PA posted over 1 year ago:
BARRY J from TX posted over 1 year ago:
JAMES L from TN posted about 1 year ago:
You need to log in as a registered AAII user before commenting.
Log InCreate an account