


Charles Rotblut leads a class in AAII's new Essential Investing Video Course. Go to https://www.aaii.com/ves for more information and to subscribe.
- How the Level3 withdrawal strategy allows for growth while minimizing real risk
- The difference between risk and volatility and the importance of avoiding panic-driven decisions during market downturns
- Guidelines for allocating safe assets, timing withdrawals and adjusting based on market conditions to maintain financial stability
AAII founder James Cloonan created his Level3 withdrawal strategy to allow investors to stay invested in growth assets while both funding current withdrawal needs and minimizing what he described as “real risk.”
In this updated look at the strategy, I explain how to follow it using recent market returns.
The Core Concepts Behind the Level3 Withdrawal Strategy
Cloonan’s book “Investing at Level3” (AAII, 2017) summarized many of the key investing concepts that he observed since he founded AAII in 1978.
A key concept underlying the Level3 withdrawal strategy is Cloonan’s view of risk. Risk is commonly used in reference to volatility, particularly downward market movement. Cloonan disagreed with this. Rather, he defined real risk as the chance of investment loss. Cloonan believed that it was a mistake to tie short-term volatility to long-term investment risk and let a desire to limit short-term drops in portfolio balances dictate our long-term investment decisions.
In Cloonan’s view, risk is the likelihood that when we must withdraw assets from our portfolio for consumption, they will have a lower value than we could reasonably expect based on our investing strategy.
Consider how he explained the difference between risk and volatility in the November 2017 AAII Journal article “Birth of an Idea: How AAII Got Started”: “If you think about it, you can get zero risk from a portfolio that goes down 10% every year with no volatility at all. It goes down 10% [per] year, so it was a ‘risk-free’ investment from the standpoint of no fluctuations around its average return. If you’re talking about the money you’d like to have when you are getting ready to retire, it’s very risky to be in that kind of investment.”
Cloonan further believed that traders and investors who try to avoid market volatility end up increasing the returns realized by investors with a long-term investment horizon. What creates fear for traders also creates opportunities for long-term investors.
A key to taking advantage of the higher long-term wealth-creating opportunities provided by the market is not panicking at times of market distress. Selling during a bear market turns a paper loss into a real loss, especially when the market recovers and you are sitting on the sidelines. The Level3 withdrawal approach is designed to prevent you from having to sell equities when the market is down.
Long-Term Investment Allocations
While there are varying opinions of where exactly a long-term period starts, Cloonan believed that four years is the length of time that divides short-term periods from long-term periods.
The use of four years as a dividing line between short- and long-term periods is based on market history. During the post-World War II era, there have been only two occasions (1973–1974 and 2007–2008) when the bear market was severe enough that the downturn—defined as the time to next stock market high—lasted over five years, using the S&P 500 index as the equity portion of the portfolio.
When the equal-weighted Wilshire 5000 index is used as the measure instead, the maximum bear market duration was four years.
Regardless of where the dividing line is set, the biggest risk for long-term investors is not achieving rates of return above the rate of inflation. Over time, inflation reduces the ability to buy goods and services with the dollars you have (purchasing power). Growth assets like stocks have historically realized rates of return far above the rate of inflation, thereby greatly reducing the chances of losing purchasing power.
Furthermore, by consistently adhering to a disciplined long-term investing strategy, you also reduce the risk of your portfolio having a lower value than what you could reasonably expect based on your investing strategy.
Short-Term Investment Allocations
Though Cloonan believed that individual investors should focus on the long term, he also believed that they “have to worry about volatility risk when [they] start to need the money.”
From the withdrawal standpoint, a short-term period is four years or less. Under this definition, enough should be allocated to safe assets to fund planned spending for four years. Cloonan describes this as the defensive segment of your portfolio.
In “Investing at Level3,” safe assets were described as “very safe in the default sense and also safe from significant price volatility in the short term. The best, of course, would be short-term Treasuries or insured [certificates of deposit (CDs)].” Investors with known dates for making withdrawals could consider high-quality municipal bonds with maturity dates matching their needs for spending and money market funds or accounts.
Cloonan acknowledged that allocating five years of planned spending to safe assets would be a more conservative approach, though he did not think this extra insurance was worth the cost. Investors wanting to take a more aggressive approach could allocate three years of planned spending to safe assets instead of four years.
The Logic Behind the Allocation
Cloonan believed that individual investors should maximize their long-term return potential by being fully invested in stocks until withdrawals are anticipated to be taken within the next four years. Any deviation from an all-equity portfolio is an effort to reduce risk. Cloonan described such actions as insuring the portfolio against volatility. Such insurance creates a cost that reduces long-term returns.
The inclusion of safe assets as a withdrawal approach is used to ensure that necessary amounts required for spending are not subject to downward market volatility. This use of safe assets is strictly tied to intended withdrawals and not a broader portfolio diversification strategy.
The Level3 approach’s major concern when it comes to short-term risk is based on an operational definition of “short term” that balances the two bad things that can happen:
- Not earning enough return on your portfolio, and
- Losing too much in down markets.
A concept at play here is that the risk of too little return and the risk of loss are linked. Both cannot be avoided. The high long-term return for stocks is compensation paid to investors for enduring downward short-term market moves.
The key for investors is to find an approach that balances risk and return in a rational way. The Level3 withdrawal strategy seeks to protect the assets needed in the near future from market downturns.
Establishing the Safe Asset Allocation for Withdrawals
Begin building the safe asset allocation four years before you begin taking planned withdrawals (e.g., your intended retirement date). Estimate how much you will need to withdraw for each of the first four years. Cloonan suggests that each annual withdrawal amount should be no more than 5% of the portfolio’s value.
During each of the four years leading up to the start of withdrawals, transfer an amount equal to one-quarter of the total projected four-year withdrawals to safe assets. This will result in the equivalent of four years of withdrawals being invested in safe assets.
Cloonan recommended making the transfers only once per year. This reduces short-term volatility and risk. It also simplifies activity and recordkeeping, and it greatly increases the chances of the process being followed.
Exceptions to this annual process can be made if your requirements change significantly. For example, if you don’t retire at the end of the year, make a one-time adjustment so your future decisions are always near the end of the year.
When to Withdrawal From Growth or Safe Assets
The Level3 withdrawal strategy takes withdrawals or transfers from the growth portion (equities) as long as the S&P 500 is within 5% of its record high.
Whatever the day of the year you mark on your calendar to determine whether or not to withdraw from growth assets (e.g., December 31), check the level of the S&P 500 at that time and compare it to the all-time highest level of the S&P 500. Cloonan preferred using end-of-year data because of its wide availability. Plus, following a calendar-year schedule gives you a chance to act just before or just after New Year’s Day (January 1) based on any income-tax considerations.
When the S&P 500 is more than 5% below its all-time high, put your portfolio in defensive mode. Withdrawals during such down years will be taken from your safe assets. Transfers from the growth portion to the safe portion would also be paused.
Withdrawals continue to be made from the safe assets as long as the S&P 500 remains more than 5% below its record high (or another benchmark of your choice) on the following annual decision days.
Once the S&P 500 is back above this this line on your decision day (e.g., at a new record high or less than 5% below), resume annual withdrawals from the equity holdings of your portfolio. In addition, you should immediately begin to restore the four-year withdrawal level to your portfolio’s defensive segment of safe assets.
Cloonan recommended replenishing your safe assets over a period of two calendar years. Restore half of the amount below the targeted four years of withdrawal during the first year. The other half will be restored during the second year. This ensures that there will be enough safe assets to tap the next time the S&P 500 falls in value.
Should a down year occur before the safe assets are fully restored, pause taking any amounts from the growth portion and simply resume taking withdrawals from the safe assets.
If the defensive mode lasts long enough that the safe investment part of the portfolio is depleted, you will have to withdraw from the equity part, but Cloonan’s research indicates that this has not happened since the Great Depression.
Those who are building their defensive portion should also pause making any transfers from growth assets to safe assets when the S&P 500 is more than 5% below its record high. Wait until the S&P 500 rises back to within 5% of its record high to begin transferring assets again. If the down market continues into the actual withdrawal period, take from any safe assets until they are used up and then sell equities. Build the safe investment portion up again after the market recovers.
Cloonan noted that using 5% from the high is an arbitrary benchmark. It could instead be set at 1%, 10% or even 20% below the S&P 500’s record high, the last of which is the usual definition of a bear market. The bigger the range, the less activity there will be. Wherever you set the line, stick to it. Consistently following the same benchmark to determine when to switch between growth and safe assets reduces the chance of mistakes coming from behavioral pressures.
You can also use a different measure than the S&P 500 to determine market highs. Cloonan recommended the S&P 500 because it is generally accepted as the primary market measure and data for it is widely available.
The process of moving into retirement mode is shown in Table 1. As you can see, based on a retirement date of January 1, 2025, money began to be shifted into the safe portion of the portfolio on January 1, 2021. No transfers were made at the start of 2023 following 2022’s bear market. Given the market’s rebound in 2023, two years of withdrawals moved into safe assets at the start of 2024.
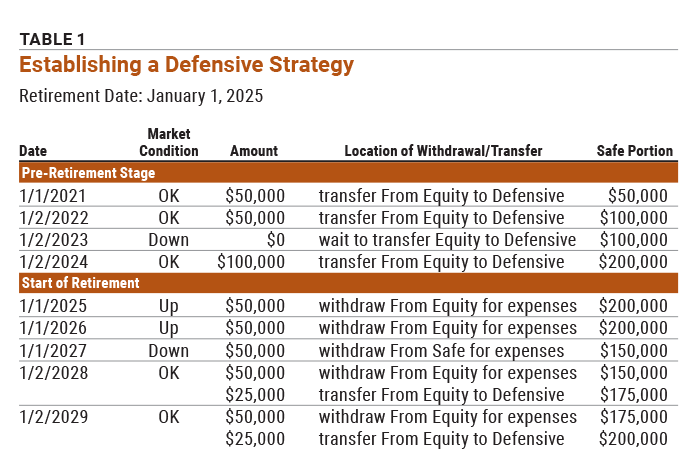
Withdrawals are taken in January 2025 as retirement starts. Growth assets are used since the market is within 5% of its previous record high. Using a scenario where the market is more than 5% below its high in January 2027, the portfolio switches to defensive mode and the annual withdrawal is taken from the safe portion. When the market returns to back within 5% of its previous high at the start of 2028, annual withdrawals are taken from the growth assets. In addition, the safe assets are replenished over a two-year period, as the market stays within 5% of its high in this scenario.
Withdrawals During Prolonged Bear Markets
If the market has not recovered after four years, withdrawals must then be taken out of growth assets. This would be out of necessity, as the defensive portion of the portfolio would have been depleted. Such an event has not occurred in the post-World War II era.
Table 2 shows how the Level3 withdrawal strategy worked during the Great Recession of 2007–2009. The S&P 500 is used as the market indicator. The safe assets held in the portfolio were assumed to have realized a return of 4%.
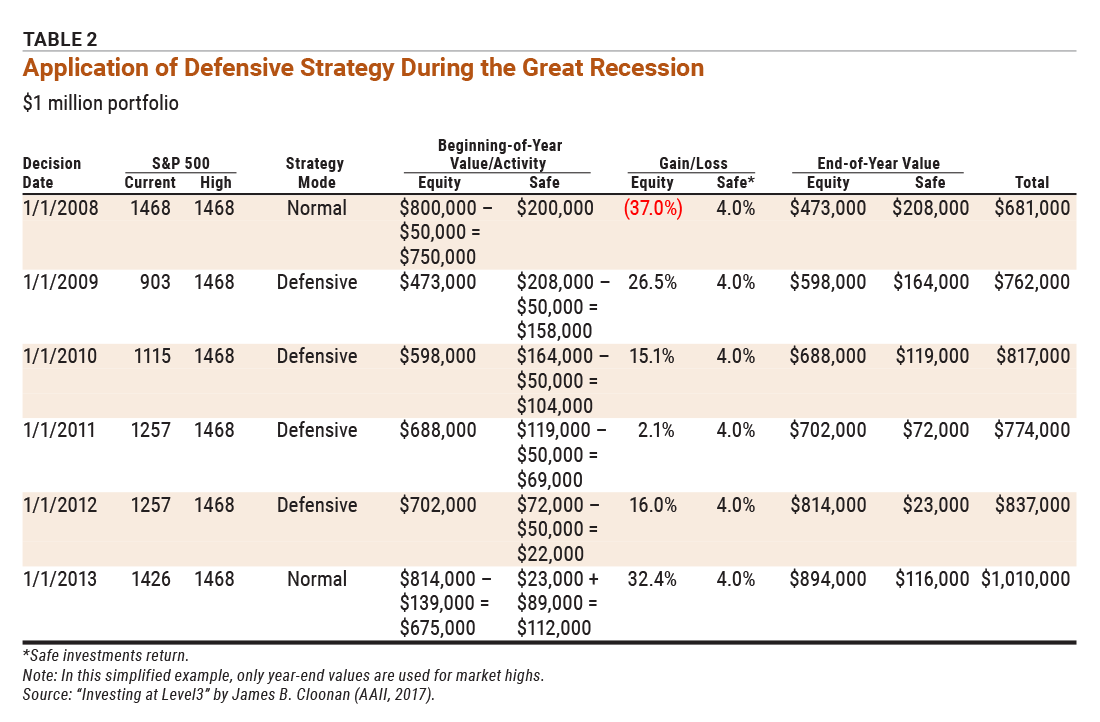
Withdrawals were set at 5% of the portfolio’s value and adjusted to inflation.
It is important to note that the withdrawal amount is in dollars, not in percentage of the portfolio. If the market drops 10%, your mortgage payment doesn’t. You would still need $50,000 per year, even though that is now 5.56% of your portfolio rather than 5%.
In Table 2, the portfolio had $1 million on January 1, 2008, and an annual withdrawal rate of $50,000. The market was not lower than the previous January, so the normal withdrawal process was used, taking the funds from the equity portion of the portfolio.
The portfolio took a 37% hit during 2008, so in January 2009, the portfolio was put in defensive mode and the $50,000 withdrawal was taken from the safe assets. The table shows the results of the strategy and the returns for each year.
On January 1, 2013, the market returned to within 5% of the old high and the strategy reverted to normal mode, taking the $50,000 withdrawal from the equity part of the portfolio along with restoring half ($89,000) of the existing shortfall in the safe assets.
Going into 2014, the portfolio had $894,000 in equities and $116,000 in bonds (assuming a 4% return for bonds in 2013). The portfolio was above its original value even after taking $300,000 out in cumulative withdrawals over the six years.
Despite the severe downturn, the four-year reserve of $200,000 in the safe assets was enough to handle all the withdrawals. However, one more down year would have required withdrawing from the equity holdings.
Adjust the Withdrawal Strategy to Your Needs
The Level3 withdrawal strategy provides a general guideline you can follow. Options for customizing it include using a different benchmark than the S&P 500, adjusting the percentage at which the S&P 500 is considered to be in a down market and taking withdrawals over the course of a calendar year instead of once per year.
The one key to using the approach is to be consistent in following its overall rules.

Related

Related

Portfolio Strategies
Why a New Allocation Approach Is Needed
Discussion
FREE REPORT

Get your free copy of our special
report analyzing the tech stocks
most likely to outperform the
market.
DAX S from MN posted over 1 year ago:
THOMAS S from OR posted over 1 year ago:
JOHN L from NJ posted over 1 year ago:
PHILLIP G from FL posted over 1 year ago:
JOHN L from NJ posted over 1 year ago:
ROBERT A from NC posted over 1 year ago:
THOMAS S from OR posted over 1 year ago:
JOHN L from NJ posted over 1 year ago:
ROBERT A from NC posted over 1 year ago:
K W from CA posted over 1 year ago:
BERT M from AZ posted over 1 year ago:
John K from OH posted over 1 year ago:
JOHN L from NJ posted over 1 year ago:
You need to log in as a registered AAII user before commenting.
Log InCreate an account