

Related

Stock Strategies
A well-designed screen can provide you with a preliminary list of stocks that hold promise.
by John Bajkowski | March 2025

“Investing is simple, but not easy” is a phrase attributed to Warren Buffett and Charles Munger. The key is to have the patience and discipline needed to perform your research and consistently stay true to your approach.
Over the years at AAII, we have studied the work of many famous and successful investors. Our goal has been to learn from the winning strategies and techniques of investing legends, modern-day professionals with a proven record of long-term investing success and even prominent academic research on investing. We have translated these approaches into a series of practical rules, or screens, that individual investors can use as a starting point for building and managing stock portfolios.
These approaches run the full spectrum, from those based on value to those primarily based on growth. Some approaches are geared toward large-company stocks, while others uncover micro-sized firms. Most fall somewhere in the middle. Nonetheless, the investment characteristics of these approaches vary widely.
It is important to understand the investment characteristics of any approach you are using in order to gain a better idea of the diversification of your portfolio and how your portfolio may react in various market environments. To simplify the process, we have also developed the A+ Investor Stock Grades, which characterize the value, growth, momentum, quality, and earnings estimate revisions (and surprises) of a company. The grades can be used to analyze the characteristics of a company or to filter stocks and identify candidates.
Screening is the application of quantitative criteria to a broad universe of stocks in order to narrow the list down to a few companies. There are thousands of publicly traded companies, and it can be overwhelming to know where to start. Screening is an efficient way of managing your stock portfolio. It allows you to focus your attention on a smaller but more promising group of stocks. It also forces you to use a consistent framework to decide which stocks to add to or remove from your portfolio.
Discipline is a common trait shared by the successful investors we have studied. It is too easy to let our emotions—such as greed, fear and even pride—take over the decision-making process and ignore the rational side of investing.
We illustrate how these approaches can be translated into a series of practical rules or screens for building stock portfolios. AAII members can access and follow over 50 different predefined stocks screening approaches on AAII.com. A+ Investor and AAII Platinum subscribers can also create their own personal stock screens and make use of the Custom Screener and Stock Grades Screener.
But how do you pick an approach that is right for you, and how did we construct the mix of criteria that make up each screen? This article provides an overview of the stock screening process and illustrates how to design or select a stock screen that makes practical sense.
It is best to look at screening as a multistage process:
An objective should always be established before constructing or selecting a screen. The objective should reflect your return objectives, risk tolerance and investing philosophy. Return objectives encompass not only the total return, but also the relative contribution of dividend income versus capital gains. Risk tolerance refers to how easily you can cope with volatility in an absolute and relative sense. Relative risk deals with the performance of a stock in relation to the market, whereas absolute risk is concerned with the performance of a stock independent of the market. Investing philosophy encompasses the style an investor uses to select stocks.
For example, a young couple usually has little accumulated wealth and a long time horizon. They are seeking to build wealth and are willing to accept higher short-term risk (volatility) for the prospect of greater long-term returns. They might choose to focus their investment on smaller companies that have greater growth potential. On the other hand, a retired couple will likely have a shorter time horizon and will be more concerned with preserving their wealth. Therefore, they might choose to focus on stocks that pay higher dividends and have lower price volatility.
Clear, focused, narrowly defined objectives lead to the best screens. Some common broad screening objectives include seeking growth stocks, stocks paying meaningful dividends, value stocks or even stocks with positive price momentum. But before the stock screening process begins, these broad objectives should be further refined to reflect the specific type of stocks you are seeking and the best way to identify these stocks.
The young couple in our example may decide to seek growth stocks in the expansion stage of their life cycle with strong earnings momentum, understanding that the portfolio will have to be carefully monitored and that higher portfolio turnover is likely. The retired couple in our example might seek out larger undervalued companies paying above-average dividends, understanding that the portfolio will likely lag the market during strong bullish periods but should decline less during bear markets.
With either strategy, there will be periods during which the portfolio underperforms other approaches. It is important to have conviction in the soundness of your approach to avoid jumping to last year’s hot trend just as it has already run its course.
The primary screening criteria should flow naturally from your objective and should attempt to filter only those companies that meet your objective. If you are a growth investor, your primary screen should provide you with a list of companies that are in the growth stage of their life cycle, not mature cyclical firms. You might require consistent annual increases in revenue or earnings. If you are a value investor, it does not make sense to spend time looking at stocks with significant growth if they cannot be purchased at attractive prices. Good companies do not always make for good stock investments if they can’t be purchased at attractive prices.
Screening criteria filter stocks by comparing a company’s numerical (“quantitative”) figures against some base figure. When defining your criteria, you will need to decide if you wish to compare on absolute or relative conditions.
Absolute, or fixed, filters compare a company’s figure against some constant that does not fluctuate over time. An example would be a screen for companies with a price-earnings (P/E) ratio below 15.0. As higher overall market levels lead to higher valuations for all stocks, the number of companies meeting this price-earnings ratio requirement will decrease. If market levels go to extremes, no suitable investments may pass the screen.
Some value investors use absolute criteria such as this to modify their exposure to the markets. During periods in which the market is priced richly, fewer attractive investments appear to replace the overvalued securities that have been sold, which leads to a net reduction in the equity allocation within the portfolio.
Alternatively, you can use relative screening filters, which compare a company’s figure against a number that is tied to a current industry or market benchmark. For example, you may be screening for companies whose price-earnings ratio is less than that of the S&P 500 index. As the S&P 500’s price-earnings ratio goes up, the screen will allow stocks with higher price-earnings ratios to pass, yet their relative attractiveness remains in place.
Some criteria should only be used on a relative basis. Metrics such as the price-to-sales (P/S) ratio, profit margins and turnover are very industry-specific and only become meaningful when compared to an industry norm or a company’s own historical norm. Low price-to-sales ratios have shown an ability to highlight attractively priced stocks, but the test for this criterion is tied to the normal profitability level for the industry in which a firm competes. A screen for stocks with absolute low price-to-sales ratios will highlight industries with low profit margins.
Screens that compare company data to other company elements or historical averages can also be useful. Because of growth prospects and certainty of growth, some companies normally trade at a higher price-earnings ratio. Just screening for price-earnings ratios below that of the market may lead to a list of stocks with poor prospects and high risk that deserve low price-earnings ratios; such companies are not really underpriced. Using a relative screen that compares a company’s price-earnings ratio against its historical norm or against its expected growth—i.e., the price-earnings-to-earnings-growth (PEG) ratio—may be a better way to point out potentially mispriced stocks that warrant a closer look.
One of the biggest mistakes in screen construction is having a list of criteria that are reasonable individually but, when combined, turn out to be contradictory. If you are looking for potential emerging high-growth companies in the early stages of their life cycle, then you should not pair a requirement for high earnings growth with a requirement for a high dividend yield. Companies that are truly growing usually need to use cash for expansion and can’t afford to pay high dividends. Combining the criteria in this way will negate the objective of the screen, probably leaving you with a list of oddball stocks that don’t really fit into any category.
AAII’s A+ Stock Grades can be used as a complement or alternative to detailed screening criteria when filtering stocks. The A+ Stock Grades system is a relative grading system based on key metrics within five investment factors that have been identified to have predictive qualities: value, growth, momentum, earnings estimate revisions and quality. The grades represent a summary of a company’s fundamentals and an overview of how a stock measures up based on these five investment factors.
Each individual grade is based on a composite score that measures the relative attractiveness of a given company. Grades range from A (favorable) to F (unfavorable). We first determine the underlying score, which ranges from 0 (unfavorable) to 100 (favorable), and then segment each score into a grade.
For example, the value composite score is based on the percentile ranks of the price-to-sales ratio, price-earnings ratio, price-to-book-value (P/B) ratio, price-to-free-cash-flow (P/FCF) ratio, shareholder yield and the ratio of enterprise value to earnings before interest, taxes, depreciation and amortization (EBITDA). The rank is scaled to assign higher scores to stocks with the most attractive valuations and lower scores to stocks with the least attractive valuations. The score is variable, meaning it can consider all six ratios or, should any of the six ratios not be valid, the remaining valid ratios. To be assigned a Value Score, stocks must have a valid ratio and corresponding ranking for at least two of the six valuation ratios.
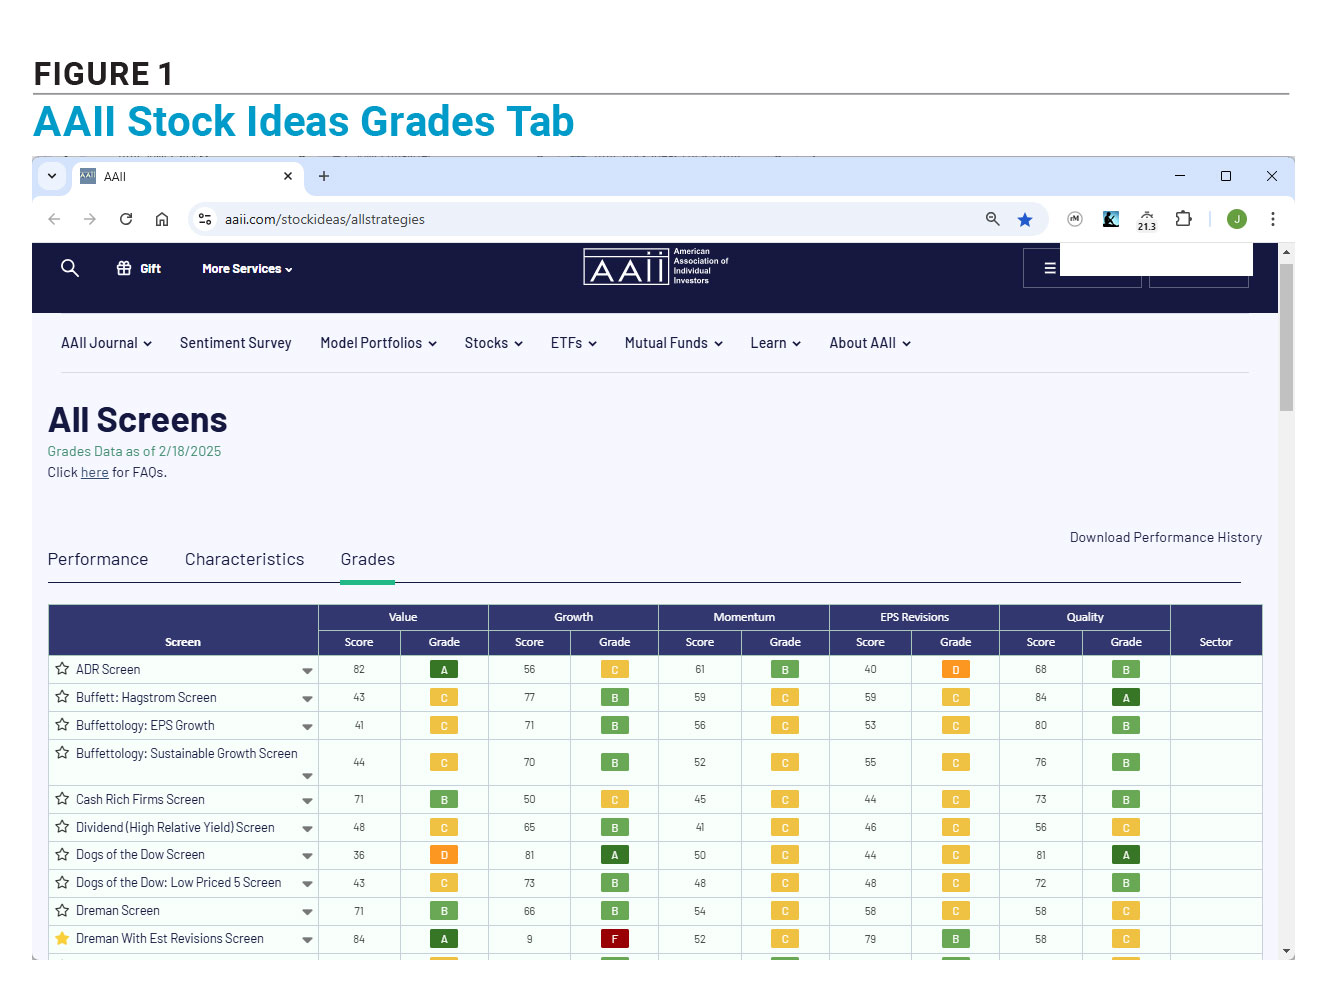
All AAII members can see the scores and grades of the AAII Stock Screens, but only A+ Investor and Platinum subscribers can use the grades to create custom screens or evaluate the grades on the AAII Stock Evaluator page. To access the complete list of stock screens that AAII has developed and tracks, select “AAII Stock Screens” from the Stocks drop-down menu on AAII.com. The All Screens table has a Grades tab (Figure 1), showing the average grades for each AAII Stock Screen based on the companies that currently meet the screen’s criteria.
Even with a clear objective and well-built primary filter, you can expect a number of companies to slip past your screen that do not embody the type of company you are seeking. Your high dividend yield screen will probably contain some companies ready to cut their dividend, and your historical earnings growth screen will probably capture some mature cyclical companies examined during their normal cyclical upturn.
While screening is designed to be a preliminary stage in the security selection process, the screening process should include secondary, or conditioning, filters. The conditioning filters should help establish that the companies that passed the primary screen did so because they meet the screen’s ultimate objective. These filters differ from the primary screening criteria in that, if used by themselves, they would not identify companies that meet your primary value or growth objective.
A primary screen for high dividend yield stocks may include a criterion for companies whose dividend yields are above that of the company’s five-year average yield. This will lead to a list of companies with relatively high dividend yields. A conditioning screen would analyze those companies to help establish that the dividend is secure and poised to continue to grow, as opposed to being at risk of being reduced. The conditioning screen might include a criterion that specifies a maximum payout ratio (dividends per share divided by earnings per share) of 50% to seek out companies that are not paying out more than half of their earnings in the form of dividends. This is a conditioning filter for the dividend yield screen because, by itself, it does not indicate if the dividend yield is high or low, nor will it indicate if the stock is priced attractively.
Most screens should include conditioning filters that look for a minimum level of growth, profitability and financial strength.
Screening provides a quantitative mechanism for selecting stocks, but it can also provide a decision framework for pruning your stock holdings. The criteria used to highlight passing stocks can be adjusted to highlight stocks in your portfolio that might be sell candidates.
The factors for selling should be decided in advance to avoid the emotional traps of selling, which range from “falling in love” with a company to ignoring a stock’s decline so as to avoid admitting that you made a mistake. A stock should be sold if it no longer meets the selection criteria, whether that is because the stock did what was expected, because there has been a fundamental change in the stock’s outlook or because of an initial misjudgment. Good companies can become bad stock holdings if they no longer match the objective of your investing approach. (See John Deysher’s article in this issue for more suggestions on when to sell.)
The addition and deletion rules of the AAII Model Shadow Stock Portfolio help to illustrate this process. The Model Shadow Stock Portfolio focuses on value-oriented micro-cap stocks. The Shadow Stock screen uses the ratio of price to book value as its primary value factor. The price-to-book level is set to match the stocks within the lowest decile (lowest 10%) of stocks trading on the New York Stock Exchange (NYSE). NYSE-listed stocks are used to establish valuation levels, but all exchange-listed stocks are considered for addition.
The cutoff is adjusted over time based on the market valuation levels. The maximum initial price-to-book criterion has ranged from 0.60 to 1.10. Currently, the price-to-book ratio must be less than 0.90 to pass the initial screen. Stocks are removed from the portfolio not when they exceed the initial price-to-book cutoff, but when their price-to-book ratio goes three times above the initial criterion.
Conditioning criteria for the Model Shadow Stock Portfolio focus on liquidity and financial strength. It is important to eliminate stocks that are in danger of being delisted and do not have an adequate market for the individual investor to take a position. To help ensure adequate liquidity, stocks must have a market capitalization of at least $30 million. Bulletin board and pink-sheet stocks are filtered out. Stocks must have a price above $4 per share. Stocks with low average daily volume (ADV) are bypassed.
Financial strength conditioning criteria for the Model Shadow Stock Portfolio focus on profitability. First, the company must report on a timely basis, so the screen eliminates any company that failed to file a Form 10-Q quarterly report in the last six months. A stock is required to have positive earnings from continuing operations over the last quarter and trailing 12 months. The Shadow Stock screen avoids foreign stocks due to the potential for different accounting procedures. Financial stocks and limited partnerships are excluded because high levels of acceptable liabilities make it difficult to make meaningful comparisons of popular ratios.
Beyond exceeding value and size limits, stocks are removed from the Model Shadow Stock Portfolio if they have negative earnings from continuing operations for a protracted period.
The lesson here is that your quantitative sell rules should grow out of your objective and investing philosophy and will likely be related to your original rules used to select the stocks.
Pure numbers don’t reveal everything about a firm, and most investing professionals also rely on subjective judgments, or qualitative criteria. A basic understanding of the individual company—its main product or service and market potential, its marketing efforts, and its ability to expand the business—is a common theme. For that reason, many prefer to focus on companies and industries that are easier to understand.
Finding companies that operate in market niches with little or no competition is also mentioned by many investing professionals, both growth- and value-oriented. Many growth-focused professionals tend to use some top-down analyses—identifying themes or economic sectors that are likely to expand in the future and selecting firms that would likely benefit from these expansions.
When designing stock screens, keep in mind that there are no miracle screens that produce lists of only guaranteed winners. A well-designed screen, however, should provide you with a preliminary list of stocks that hold some promise. A screening system also provides you with a framework to ask intelligent questions about the stocks you are considering as well as the stocks you currently own.
The objective of value screens is to identify companies whose market price is low relative to value measures based upon factors such as sales, earnings, dividends, cash flow or assets.
Sample Primary Criteria
Current price-earnings (P/E) ratios can be computed using historical (trailing) earnings or projected (forward) earnings. Benjamin Graham and Robert Shiller have even used an average of past earnings for the construction of the price-earnings ratio:
Sample Secondary/Conditioning Criteria
Focus on the earnings potential of the company:
Focus on company operations and profitability:
Focus on financial strength:
Sample Primary Criteria
Current price-to-book-value (P/B) ratio can be computed with or without intangible assets:
Sample Secondary/Conditioning Criteria
Sample Primary Criteria
Current dividend yield is computed with the expected dividend payout over the next four quarters (indicated dividend):
Sample Secondary/Conditioning Criteria
Sample Primary Criteria
Price-to-sales (P/S) levels tend to be tied to profit margins and growth rates:
Sample Secondary/Conditioning Criteria
The objective of growth screens is to identify companies with desirable secular growth in sales, earnings and/or cash flow. Normally, just screening for absolute high levels of historical or expected growth identifies companies that tend to underperform relative to the expectations baked into the stock price. Analysis of growth-oriented screens with a successful track record have these common screening criteria.
Sample Primary Criteria
Sample Secondary/Conditioning Criteria
Stock Strategies

Portfolio Strategies


JOHN L from NJ posted over 1 year ago:
You need to log in as a registered AAII user before commenting.
Log InCreate an account