


Related

AAII How-To
Of the 55 different screening approaches tracked on AAII.com, 42 were up for the year through December 10, 2024.

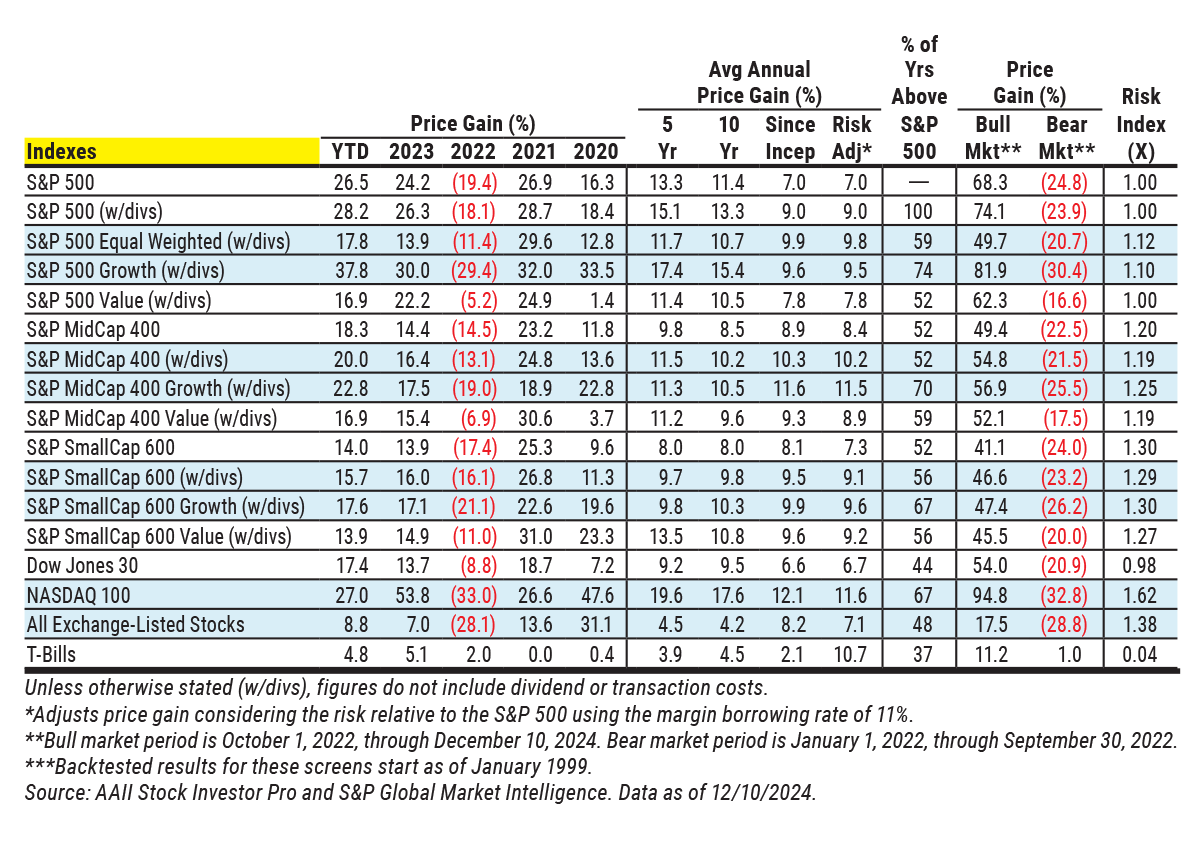
The stock market was generally strong during 2024, with larger communication services, financial, technology and utility stocks leading the charge. The S&P 500 index is up 28.2% through December 10, 2024, compared to a total return of 20.0% for the S&P MidCap 400 index and 15.7% for the S&P SmallCap 600 index. Once again, growth stocks are showing stronger performance than value stocks during the year, with the S&P 500 Growth index up 37.8%, compared to a return of 16.9% for the S&P 500 Value index.
Inflation moderated in 2024, allowing the Federal Reserve to begin trimming interest rates in September. Much of the stock market volatility during the year reflected concerns about the strength of the economy, persistently higher levels of inflation and interest rates, and uncertainty surrounding the presidential election. A clear and uncontested presidential election helped to fuel a strong market rally during November, but the risk of an economic downturn continues, stock valuations remain elevated compared to their historical norms and the prospect of global trade war has some economists concerned. Fortunately, the domestic economy and company profits remain strong, inflation continues to moderate and valuations are more attractive for out-of-favor market segments such as small company stocks.
Seventy-six percent of the stock screens AAII tracks posted gains during 2024, down from 89% during 2023. Screens gained an average of 20.0% during 2024, compared to 17.8% in 2023.
AAII has been developing, testing, refining and tracking a variety of quantitative stock strategies for over 25 years using Stock Investor Pro, AAII’s fundamental stock screening and research database program. These strategies fall into two categories: “guru” screens, which follow the investing methodologies of well-known professionals, and “factor” screens, which focus on specific financial data points.
This annual recap provides a view into the strongest- and weakest-performing strategies for the past year, with the goal of understanding any common themes investors can use to successfully utilize stock screens.
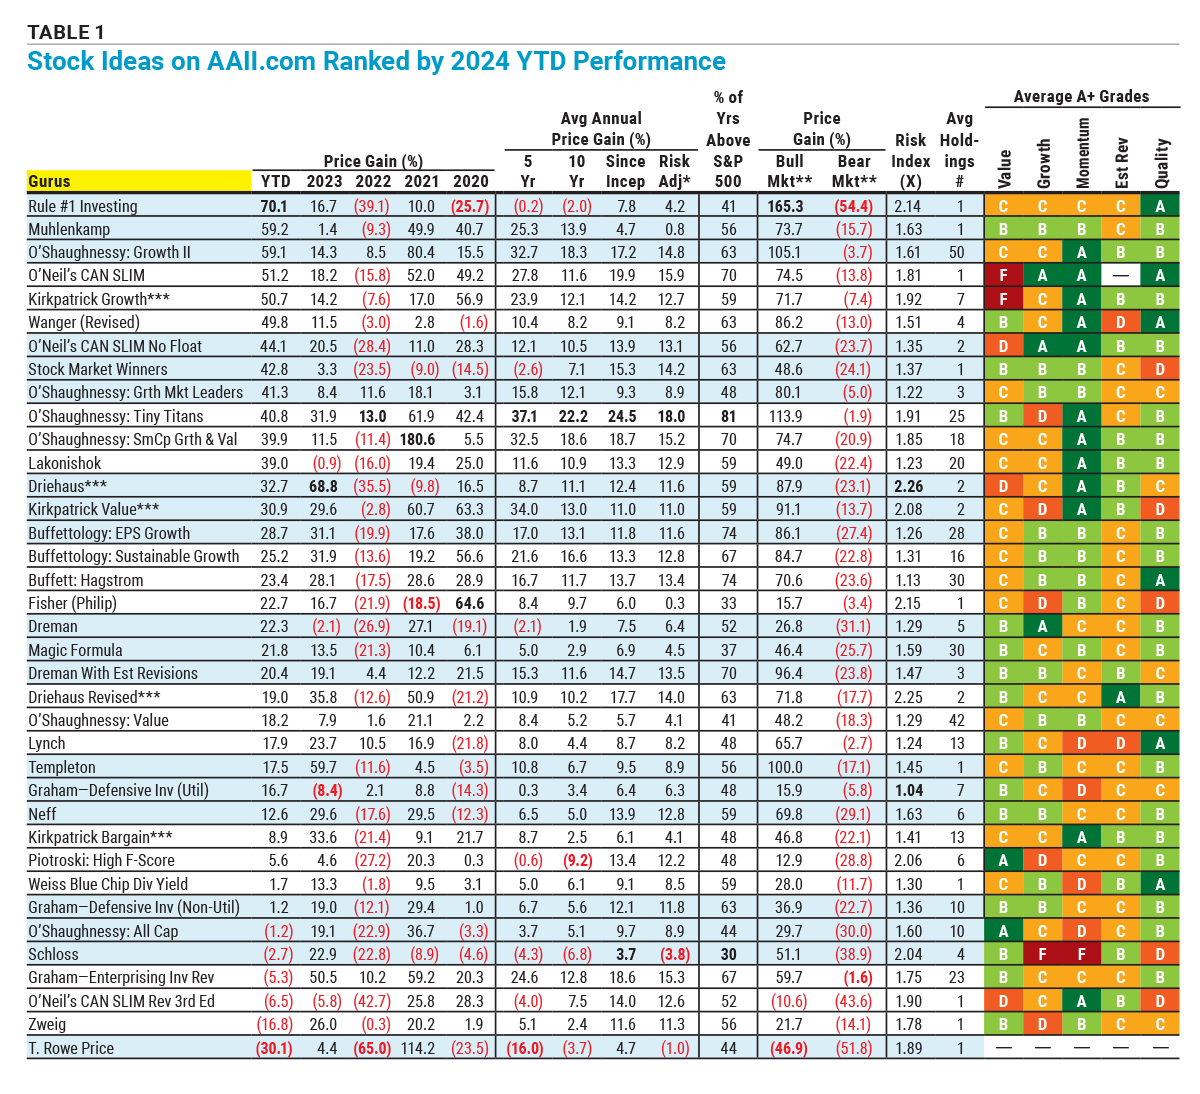
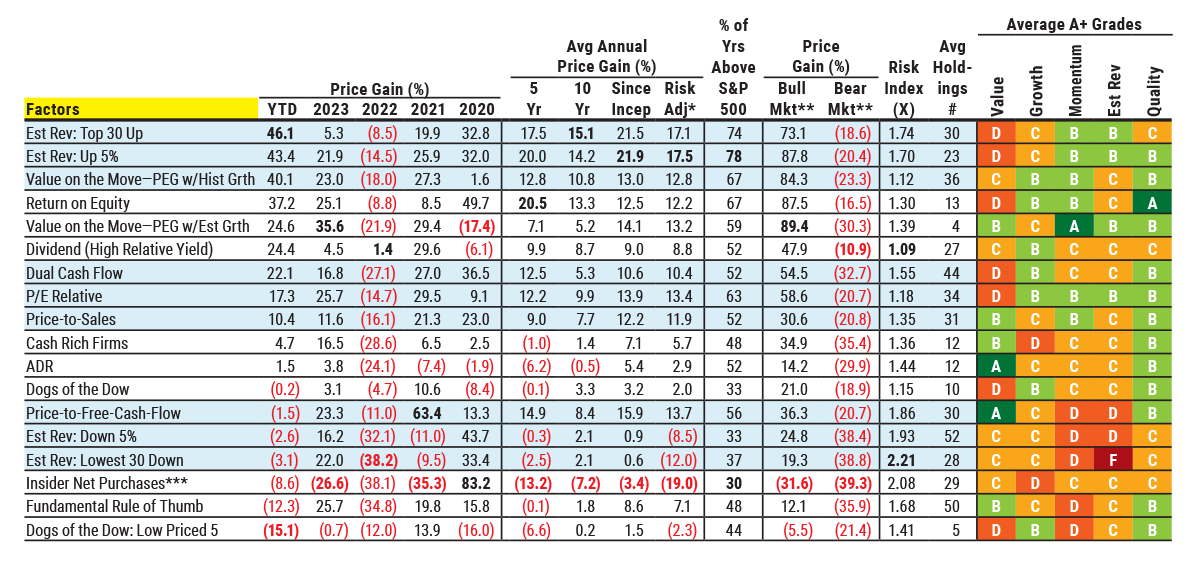
Table 1 summarizes the performance and variability of the screening strategies that AAII tracks, with the guru and factor screens ranked separately in descending order by year-to-date price change through the close on December 10, 2024 (see the AAII Stock Ideas box for more information about how we track and calculate performance). Table 1 presents the price change performance (excluding dividends and transaction costs such as commissions, bid/ask spreads, time and price slippage, etc.) over various periods for each approach. The average A+ Investor Grades for the recent stocks passing these screens help to understand how the companies passing each screen compare to the general domestic market when it comes to valuation, growth, price momentum, earnings estimate revisions and surprises, and quality.
Download the Excel spreadsheet for Table 1.
The Price Gain and Average Annual Price Gain columns in Table 1 represent the annualized percentage price gain or loss realized by a hypothetical portfolio invested in the stocks passing each screen over varying periods from January 1, 1998, through December 10, 2024. Note that six of AAII’s screening strategies make use of elements that we did not have in our dataset until 1999. The long-term performance and risk-adjusted returns of these strategies—footnoted with three asterisks in Table 1—do not include 1998 performance, a year in which the large-cap growth strategies did well.
These figures only represent price change and do not include dividend payments or dividend reinvestment. Therefore, the results of screens that tend to isolate large, dividend-paying stocks—such as the High Relative Dividend Yield factor screen—do not receive a boost from dividend payments or reinvestment.
The 34 stocks currently passing the High Relative Dividend Yield screen are yielding an average of 2.6%. Investors holding shares in these stocks would therefore have a higher annual return by approximately this amount for the coming year.
Of the 55 different screening methodologies tracked on AAII.com, 42 were up for the year through December 10, 2024. However, of the 42 that posted year-to-date gains, only 19 outperformed the S&P 500’s 26.5% price gain through December 10. The median price gain of all AAII Stock Screens was 20.4%, compared to a median price gain of 16.8% in 2023 when the S&P 500 gained 24.2% and exchange-listed stocks were up 7.0%. Exchange-listed stocks are up 8.8% in 2024.
Of the 55 stock screening strategies that AAII tracks, most of them have posted gains over the last five- and 10-year periods. Fifteen screens show a loss for their average annualized price gain over the last five years, while six were in the red over the last 10 years.
Interestingly, 17 of the 55 screening methodologies AAII tracks posted better price returns than the S&P 500 over the last five years, but only 16 posted better results than the S&P 500 over the last 10 years.
For 2024 through the close on December 10, the top AAII guru strategy is our interpretation of the Rule #1 Investing approach, up 70.1% for the year. The Rule #1 Investing strategy was developed by Phil Town, who was inspired by the work of Warren Buffett. According to Buffett, there are only two rules to investing. Rule #1: Don’t lose money. Rule #2: Don’t forget rule #1. In his book, “Rule #1” (Crown Publishing Group, 2006), Town lays out an investing strategy that attempts to follow Buffett’s rules. The approach seeks to identify “wonderful companies” at attractive prices. Wonderful companies possess four important qualities—meaning, moat, management and margin of safety. See the box "The Passing Companies Behind the Top Strategy of 2024" for more on the Rule #1 approach.
All of the screens and their results are presented on AAII.com. If you find a screening approach interesting, you can favorite the screen by clicking on the star next to its name. Favoriting makes it easy to follow specific screens and get additional insight via the My Screens tool, which is available to all AAII members. The five screens tracked the most by AAII members are: O’Shaughnessy Tiny Titans, O’Shaughnessy Small Cap Growth & Value, Buffettology Sustainable Growth, Buffett Hagstrom and O’Neil CAN SLIM Revised 3rd Edition. Unsurprisingly, Estimate Revisions Lowest 30 Down is the least-favorited screen.
The top AAII factor approach for 2024 is the Estimate Revisions Top 30 Up screen. It gained 46.1% through December 10, 2024. The screen seeks out 30 companies that have had the largest percentage increases in their current-year consensus earnings estimate over the last month. Revisions to consensus earnings estimates signal a change in the assessment of a company’s prospects by the analyst community. Security prices are established through expectations, and prices change as these expectations change. When earnings estimates are revised significantly upward—5% or more—stocks tend to show above-average performance. Stock prices of firms with downward revisions show below-average performance after the adjustment.
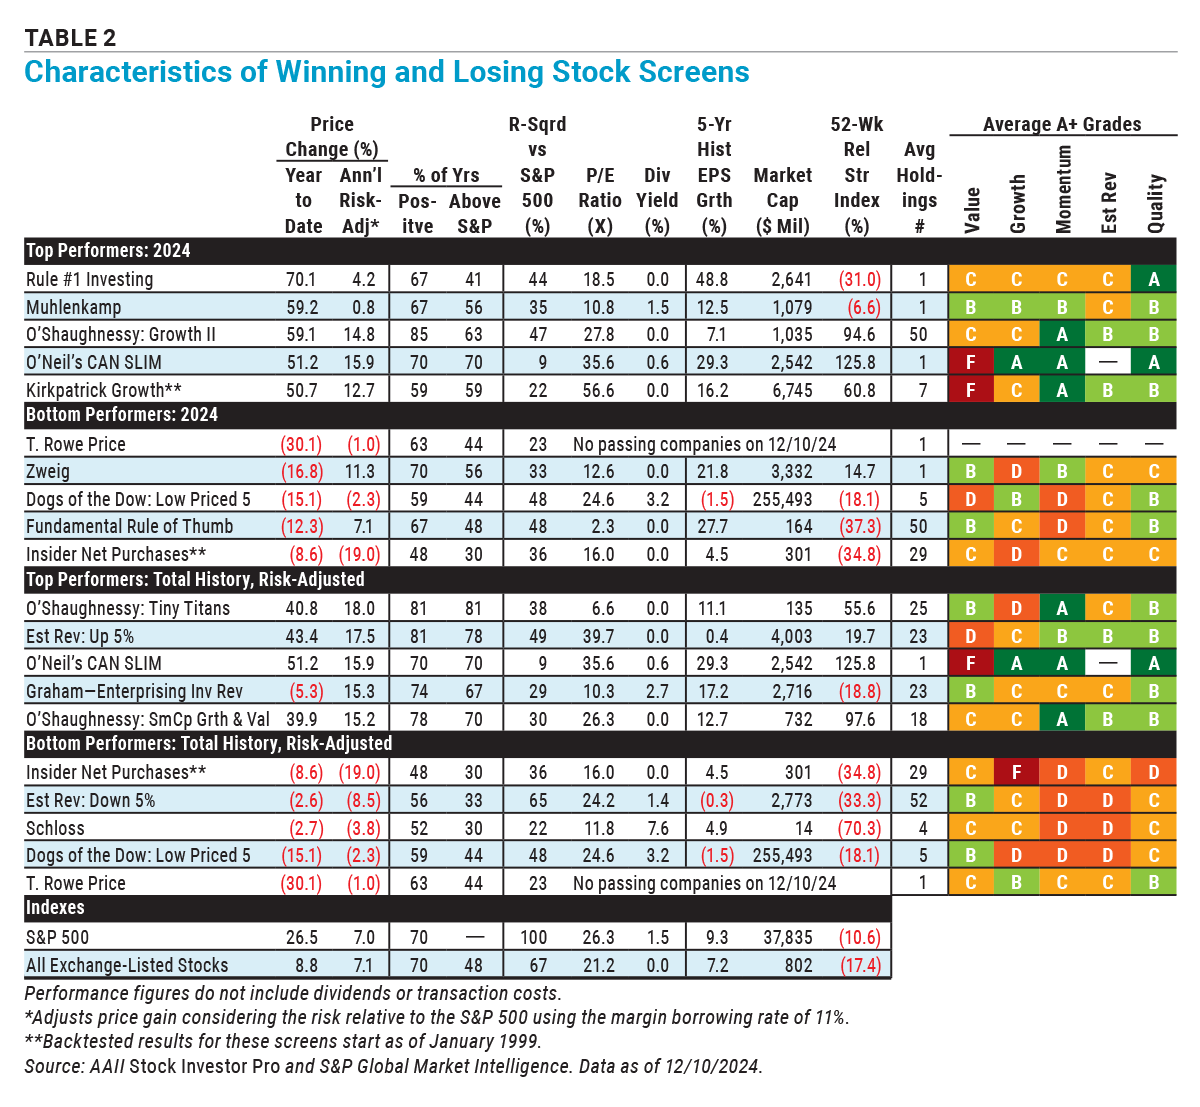
Table 2 highlights the top- and bottom-performing screening strategies for 2024, along with risk-adjusted winners and losers since 1998.
Of the 55 AAII Stock Screens, 42 posted gains for the year through December 10, 2024, slightly weaker than 2023 when 49 screens finished in the black. The median year-to-date price gain across all screens is 20.4%, compared to the 26.5% price increase of the large-cap S&P 500 index. Like in 2023, the strongest gains have come from the large-cap growth segment, with exchange-listed stocks showing a price gain of just 8.8%. Only 19 screens (35%) outperformed the S&P 500 in 2024, up from 16 screens (29%) in 2023 when the S&P 500 rose 24.2%.
We have added indications of the percentage of years a given approach has posted positive returns as well as the percentage of years each screen’s price change has topped that of the S&P 500. The S&P 500 has achieved positive price gains in 70% of the calendar years over the last 27 years. The Insider Net Purchase screen has the weakest record, with only 48% of its calendar-year returns positive. Of the 55 stock screening strategies, the Dreman With Estimate Revisions screen had the highest percentage of positive years at 89%. It is the 11th-best-performing strategy on a risk-adjusted basis. The O’Shaughnessy Tiny Titans screen has outperformed the S&P 500 the most on a calendar-year basis since inception, 81% of the last 27 years.
While the S&P 500 is the most widely followed market index, it represents only a small proportion of publicly traded companies and emphasizes the largest firms. The R-squared statistic in Table 2 indicates how much of a screen’s performance can be explained by the S&P 500’s price movement: An R-squared of 100% means a screen’s monthly price movements fully mirror those of the S&P 500. The O’Neil CAN SLIM screen has been a strong performer in 2024 and over the long term. Its performance moves very differently from the S&P 500, with an R-squared of just 9%, indicating only a small portion of its monthly returns aligns with the index’s movements.
The market capitalizations for the major S&P indexes as of December 13, 2024, were:
The top-performing 2024 screens defied the large-cap dominance trend, with holdings ranging from small-cap stocks currently in the O’Shaughnessy Growth II screen to mid-cap stocks in the Kirkpatrick Growth screen. These screens often held concentrated portfolios with a small number of passing stocks.
Except for the Dogs of the Dow Low Priced 5 screen, the bottom-performing screens tended to highlight even smaller companies. The Insider Net Purchases screen is notable because it excludes companies with market caps above $1.0 billion. Despite research suggesting insider buys of smaller companies outperform those of larger firms, this strategy has delivered poor short- and long-term results.
The A+ Investor Value Grade evaluates multiple metrics, including the price-to-sales (P/S) ratio, price-earnings (P/E) ratio, the ratio of enterprise value to earnings before interest, taxes, depreciation and amortization (EBITDA), shareholder yield, price-to-book-value (P/B) ratio and price-to-free-cash-flow (P/FCF) ratio. Successful value screens typically focus on lower ratios while prioritizing relative valuations against a company’s history, industry or market.
The top-performing screens in 2024 tended toward those that emphasize growth in earnings and price momentum over value. The stocks currently passing the Kirkpatrick Growth screen have a median price-earnings ratio of 56.6 and an A+ Value Grade of F. The Muhlenkamp screen had the highest A+ Value Grade of B and the lowest price-earnings ratio of 10.8.
There is a broader mix of value approaches within the top long-term performers group. This group includes everything from the value-focused Graham Enterprising Investor Revised and O’Shaughnessy Tiny Titans screens to the growth-oriented O’Neil CAN SLIM screen, which lacks any value filters. The Estimate Revisions Up 5% screen completely ignores valuation and other fundamental or price factors.
The Rule #1 Investing screen has the highest historical earnings growth rate of 48.8% but an average A+ Investor Growth Grade of C. The Growth Grade emphasizes consistency of growth and cash flow generation over high absolute levels of growth. The Dogs of the Dow Low Priced 5 screen and the Estimate Revisions Down 5% screen are the only strategies that currently have passing companies with negative median historical growth rates.
Historically, screens targeting reasonable or consistent growth perform better than those focused on extremely high growth rates. High growth stocks often disappoint, as investors overpay and prices decline when expectations aren’t met. Stock passing the O’Neil CAN SLIM screen must have at least five consecutive years of earnings increases, contributing to the approach’s strong A+ Investor Growth Grade of A.
Momentum measures a stock’s price change relative to others over a specific period. Stocks with high momentum tend to outperform, while those with low momentum typically underperform.
The relative strength index in Table 2 compares stock performance to the iShares Core S&P 500 ETF  (IVV). A value of 0.0 indicates performance equal to the S&P 500, while a value of 10.0 means outperformance by 10%. In contrast, the A+ Momentum Grade places greater weight on recent quarterly performance (40%) and evaluates a stock’s price change relative to all others.
The O’Shaughnessy Tiny Titans screen exemplifies momentum, with its current holdings outperforming the S&P 500 by 55.6% over the past 52 weeks. This strategy focuses on the 25 micro-cap stocks ($25 million to $250 million market cap) with the highest 52-week relative strength and price-to-sales ratios below 1.0.
Among the top screens, momentum filters are key components of the Kirkpatrick Growth, O’Neil CAN SLIM, O’Shaughnessy Growth II, O’Shaughnessy Small Cap Growth & Value, and O’Shaughnessy Tiny Titans screens.
Earnings estimate revisions and earnings surprises can significantly impact share prices for up to one year. The long-term performance trends reinforce this: Earnings estimate revisions screens focusing on upward revisions are among the top risk-adjusted performers, while those targeting downward revisions rank among the worst.
Most successful strategies include financial strength filters, not as sole criteria but to exclude companies with weak fundamentals. Quality filters work best when combined with value, growth or momentum requirements. The top screens over the long term have A+ Quality Grades of B or better, while the weakest-performing screens tend to have lower Quality Grades.
The long-term top-performing strategies share several key traits:
A range of market indexes are also provided in Table 1 to help understand the current and long-term market environment in which these screening strategies performed. As previously mentioned, growth-oriented strategies once again performed better than value approaches in 2024. Large-cap growth was especially strong again during the year.
Through the close on Tuesday, December 10, 2024, the S&P 500 Value posted a total return of 16.9%, while the S&P 500 Growth had a return of 37.8%.
Within the mid-cap segment, the S&P MidCap 400 Value index has a total return of 16.9% year to date, while the S&P MidCap 400 Growth index is up 22.8%.
The S&P SmallCap 600 Growth index is up 17.6% for the year, while the S&P SmallCap 600 Value index is up 13.9% through December 10, 2024.
The technology-heavy Nasdaq 100 index, which includes the 100 largest nonfinancial companies listed on the Nasdaq stock exchange, gained 27.0%, down from its incredible 53.8% gain in 2023.
Stocks in the communication services and technology sectors continued their strong performance during 2024. The strong performance of utility stocks during 2024 caught many by surprise. Rapid growth in the use of artificial intelligence (AI) is helping fuel demand for data centers and electricity. Financial sector stocks are benefiting from declining interest rates.
The Rule #1 Investing screen delivered an impressive performance in 2024, gaining 70.1% year to date through December 10, 2024, compared to the 8.8% gain for exchange-listed stocks. To fully understand a stock screen’s success, it’s useful to look beyond simple gain/loss data and examine the individual stocks driving the overall return.
The Rule #1 Investing approach is inspired by a popular Warren Buffett quote in which he states that there are only two rules to investing:
Rule #1: Don’t lose money.
Rule #2: Don’t forget rule #1.
In his book, “Rule #1” (Crown Publishing Group, 2006), author Phil Town outlines an investing strategy designed to follow Buffett’s rules.
Town, a former Green Beret turned river guide, learned about rule #1 investing from a client who narrowly escaped death during one of his guided trips. The core of the strategy is to purchase wonderful companies at attractive prices. Town defines wonderful using his “four Ms”: meaning, moat, management and margin of safety.
A company has meaning if investors can imagine it being their sole source of financial support for the next 100 years. To make this determination, investors need to understand what the company does and who runs it. Town suggests focusing on companies connected to your work, hobbies or interests to leverage existing knowledge and familiarity.
A moat protects a company much like the moat of a castle. Town identifies moats based on certain financial strengths and competitive advantages. Companies with wide moats are better positioned to defend against competitors and are easier to analyze for their long-term prospects.
Characteristics of a wide moat include:
These qualities make such businesses both stable and predictable, ensuring they are among the top players in their sectors.
Given Town’s 100-year perspective on financial reliance, strong management is essential. He emphasizes the importance of owner-oriented leaders who act in the best interests of shareholders.
Town cites Microsoft Corp.’s (MSFT) Bill Gates and Berkshire Hathaway’s (BRK.A) Warren Buffett as exemplary owner-oriented CEOs—leaders with vision, accountability and a focus on long-term success.
Once wonderful companies are identified, the next step is to purchase them at attractive prices. This is where the margin of safety comes in.
The margin of safety reflects the difference between a company’s true value and its current stock price. By buying stocks at a significant discount to their intrinsic value, investors gain a buffer against potential errors in analysis.
Town compares the margin of safety to an investing life jacket: Even if the analysis is imperfect, the discount helps protect investors from significant losses.
The Rule #1 Investing strategy combines these principles—meaning, moat, management and margin of safety—to identify and invest in high-quality businesses at favorable prices, aligning with Buffett’s timeless investing rules.
Only a handful of stocks have been passing the Rule #1 Investing screen recently. The screen was fully invested throughout 2024. However, the screen only generated three passing companies on average each month. For the year, 16 unique companies were uncovered by the screen.
Historically, the strategy has averaged one stock per month, whereas the typical AAII stock screen has averaged roughly 16 passing companies per month since the start of 1998.
When following a given strategy, spreading your investment around into more stocks will lower your volatility, as investing in a small number of companies makes a portfolio more susceptible to individual stock price movements.
Table 3 presents the 16 companies that passed the Rule #1 Investing screen in 2024, as well as their performance while they were held in the hypothetical portfolio, the number of months each stock was held during the year and select current financial data.
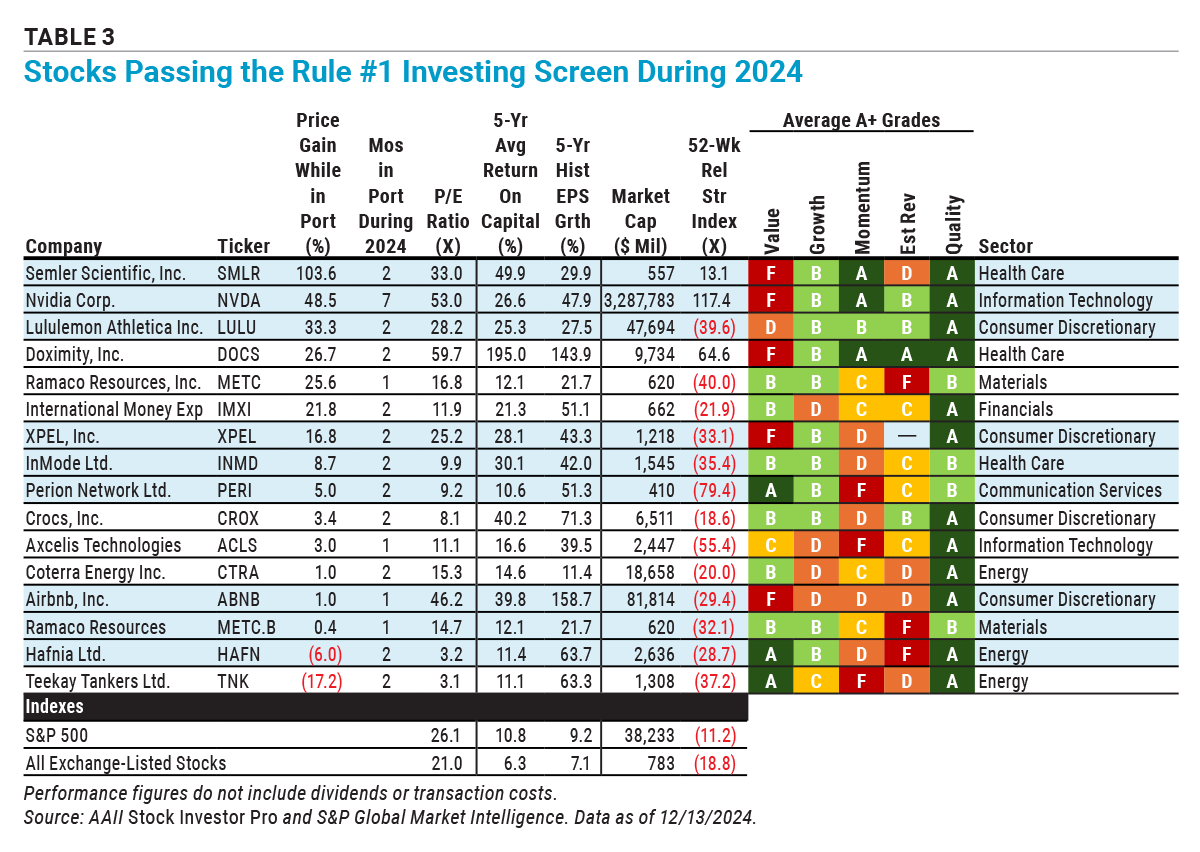
Semler Scientific Inc. (SMLR) was the best-performing stock passing the Rule #1 Investing screen in 2024 with a gain of 103.6%. It was held in the portfolio for two months, including October, during which it gained 94.1%. Town looks for companies with a high return on invested capital (ROIC) and Semler Scientific’s five-year average of 49.9% is well above the 10.8% median for the companies in the S&P 500 index. Town states that a strong return on invested capital is an indication that the company’s management is on the side of its owners.
Nvidia Corp. (NVDA) passed the Rule #1 Investing screen in seven months of 2024, gaining 48.5%. Town looks for companies that grow book value by being profitable and retaining earnings. As retained earnings increase, companies can use this “surplus” (as Town calls it) to increase their market share or develop new products. Nvidia’s high level of return on invested capital and strong historical growth has fueled its 35.7% growth in book value over the last five years.
Town reminds investors not to forget that the top line—sales or revenues—powers the bottom line. The Rule #1 Investing screen looks for compound average annual growth rates for both sales and earnings per share of at least 10% over the last five years. Airbnb Inc. (ABNB), which passed the screen for only one month, has the highest historical earnings growth rate of 158.7%.
Cash flow growth helps to determine whether a company is increasing its cash position with its profits or has only paper profits. The Rule #1 Investing screen looks for compound average annual free cash flow growth of at least 10% over the last five years.
Town says that it is important that a company’s debt level is not too high. In order to pass the Rule #1 Investing screen, companies must have long-term debt that is no more than three times its free cash flow for the last four quarters. This is a type of debt coverage ratio.
The final piece of the puzzle is the margin of safety price. The margin of safety protects an investor in the event that a wonderful company is, in fact, not quite so wonderful. Therefore, Town does not want to pay more than $0.50 for every dollar of a company’s value. The Rule #1 Investing screen uses a unique valuation estimate developed by Town referred to as the “sticker price.” Nvidia is currently trading at 37.7% of its sticker price.
Two of the companies that passed the Rule #1 Investing screen in 2024 lost money while held in the hypothetical portfolio. The worst-performing stock from this group was Teekay Tankers Ltd. (TNK), which fell 17.2% in November and December, the two months it was held in the portfolio.
The 2024 results for the Rule #1 Investing screen are well above its long-term compound annual average of 7.8% since inception in 1998. It was able to achieve that success with a concentrated portfolio during 2024.
AAII has performance history for most of its stock screens dating back to 1998, spanning 27 years. The O’Shaughnessy Tiny Titans screen boasts the best long-term performance, delivering a 24.5% annual price gain since inception. Developed from James O’Shaughnessy’s book “Predicting the Markets of Tomorrow: A Contrarian Strategy for the Next Twenty Years” (Penguin Group, 2006), the screen is tailored for aggressive investors seeking undervalued micro-cap stocks with upward price momentum.
O’Shaughnessy highlights that micro-cap stocks often lack analyst coverage, creating opportunities for substantial upside when overlooked stocks perform well. These stocks also have a low correlation with the S&P 500, which primarily consists of mid- and large-cap companies. However, O’Shaughnessy cautions that micro-caps are highly volatile, making them suitable only for investors comfortable with significant portfolio swings. The Tiny Titans screen focuses on small-cap stocks with low price-to-sales (P/S) ratios and strong 52-week relative price strength. Impressively, the strategy has outperformed the S&P 500 in 81% of individual calendar years.
The Estimate Revisions Up 5% screen is the top-performing factor screen over the long term, achieving a 21.9% annual gain since inception. Its success stems not only from strong annual returns but also from avoiding significant underperformance during down years. Since 1998, the screen has recorded only five down years and outperformed the S&P 500 in 78% of individual calendar years.
This strategy identifies companies whose annual earnings estimates have been raised by at least 5% over the previous month. Stocks are added to the screen in the month following these upward revisions by analysts.
In contrast, two of AAII’s worst-performing screens—Estimate Revisions Lowest 30 Down and Estimate Revisions Down 5%—highlight the significant role earnings estimate changes play in short-term stock performance. Positive revisions often signal improved expectations, while negative revisions can correlate with underperformance.
Table 1 also presents the risk-adjusted return for each of the strategies that AAII tracks. This calculation adjusts the performance of each approach using their volatility as measured through standard deviation of returns, penalizing screens with higher standard deviations. (For a more detailed explanation of the risk-adjusted return calculation, see the Calculating Risk-Adjusted Return box below). Using risk-adjusted returns since inception (1998), the best-performing strategies are still the O’Shaughnessy Tiny Titans and Estimate Revisions Up 5%, gaining 18.0% and 17.5%, respectively.
Six of the 55 AAII stock screening strategies had negative average annual risk-adjusted returns since inception through 2024, unchanged from 2023. On a risk-adjusted basis, the Insider Net Purchases strategy has the weakest risk-adjusted return. The higher level of risk for this approach (2.08 risk index) lowered its absolute loss of 3.4% to a risk-adjusted loss of 19.0%.
The formula for calculating the risk-adjusted return is as follows:
Margin Rate + (Benchmark Std Dev ÷ Portfolio Std Dev) x (Portfolio Return – Margin Rate)
Where:
This calculation assumes that the portfolio return for a given stock screen is higher than the margin rate. If it isn’t, the risk-adjusted return calculation would be as follows:
Margin Rate + (Portfolio Std Dev ÷ Benchmark Std Dev) x (Portfolio Return – Margin Rate)
Following this methodology, we calculate the risk-adjusted returns since inception for all of the AAII Stock Screens.
The majority of stocks are positively correlated with the overall market: When the market rises, many stocks follow, and during downturns, their values decline. By analyzing stock screen performance during recent bull and bear markets, we can assess a strategy’s ability to capitalize on uptrends and limit losses during downtrends.
Following the long bull market from 2009 to 2020, we have seen a rapid succession of bull and bear periods. The latest bear market spanned the first nine months of 2022, while the current bull market began on October 1, 2022, and is measured here through December 10, 2024.
During this bull market, the S&P 500 posted a price gain of 68.3%. The top-performing guru screen was the Rule #1 Investing approach, which surged 165.3%, while the Value on the Move PEG With Estimated Growth strategy led the factor screens with a remarkable 89.4% gain. The Value on the Move PEG With Estimated Growth strategy is a growth-at-a-reasonable-price approach that uses price momentum as a confirmation that the market recognized the attractiveness of a company.
In the latest bear market (January 1, 2022, to September 30, 2022), the Graham Enterprising Investor Revised screen had the smallest loss among the guru screens, declining just 1.6%, while the Rule #1 Investing approach experienced the largest loss, down 54.4%.
Within the factor group, the High Relative Dividend Yield screen performed best during the bear market, losing 10.9%, while the Insider Net Purchases screen saw the largest decline at 39.3%. By comparison, the S&P 500 dropped 24.8% during the same period.
Strategies that performed best in the most recent bear market often included a dividend component, which can provide price support during downturns as investors seek conservative, income-generating stocks.
The risk index measures the variability of returns for a stock screening strategy relative to a benchmark. It is calculated by dividing the standard deviation of a strategy’s returns by the standard deviation of the benchmark’s returns—in this case, the S&P 500. Standard deviation, which measures return volatility, is based on monthly returns since the beginning of 1998.
The risk index provides a relative measure of risk: The S&P 500 has a risk index of 1.00. Strategies with a risk index below 1.00 are considered less risky than the benchmark, while those above 1.00 carry higher risk.
All of AAII’s screens have risk indexes above 1.00, which is expected. Stock screens typically pass a small set of stocks—anywhere from a handful to around 50—whereas the S&P 500 consists of 500 actively traded companies. Among the guru screens, the Graham Defensive Investor Utility approach has the lowest risk index at 1.04, while the High Relative Dividend Yield screen has the lowest risk index among the factor screens at 1.09. Both screens focus on “safer” stocks—utilities and dividend-paying stocks, respectively.
On the other end of the spectrum, the Driehaus screen has the highest risk index among the guru screens at 2.26, while the Estimate Revisions Lowest 30 Down screen has the highest risk index among the factor screens at 2.21.
A key benefit of quantitative stock screening is its ability to narrow down a large universe of stocks to a more manageable list. For screens to be effective, they should yield enough passing stocks to provide alternatives, but not so many that investors become overwhelmed.
The average number of passing stocks reflects how many stocks typically pass a filter each month, though this can vary with market cycles. For example, the top-performing Rule #1 screen for 2024 currently has 10 passing stocks but recently averaged just one. When only a small number of companies pass a filter, the resulting performance tends to be more volatile and can deviate significantly from the broader market.
AAII has been developing, testing and refining a wide range of screening strategies over the years. Many of the screens follow the approaches of popular investing professionals, while others are tied to basic principles of investing. These approaches run the full spectrum, from those that are value-based to those that focus primarily on growth, while most fall somewhere in the middle. Screens following the approach of an investing professional do not represent their actual stock picks. The rules of each screen are defined by our interpretations of their respective investing approaches.
The results of the screening strategies, and the criteria for each screen, are programmed into the Stock Investor Pro program. Passing companies and screening results can also be accessed by all members via AAII.com. The daily screening results are found on the Stocks page of AAII.com. Members can rank the screens using the Screen Power Rankings tool and favorite screens to track passing companies via the My Screens feature. Performance statistics on the screens can be accessed directly via the AAII Stock Screens section within the Stocks menu.
The performance of the stocks passing each screen is tracked on a monthly basis. The month-to-month closing price is used to calculate the return, with equal investments in each stock at the beginning of each month assumed. The impact of factors such as commissions, bid/ask spreads, time slippage (the time between the initial decision to buy a stock and the actual purchase) and taxes is not considered. This overstates the reported performance, but all approaches are subject to the same conditions and procedures. Higher turnover portfolios typically benefit more from these simplified rules. Keep in mind, however, that performance figures for the AAII stock screening strategies represent price change only and do not include dividend payments or dividend reinvestment. Therefore, the results of screens that tend to isolate large, dividend-paying stocks—such as the Dogs of the Dow (in the factor category)—do not receive a boost from dividend payments or reinvestment.
Sell rules are the same as the buy rules: The hypothetical portfolios are completely reallocated using each subsequent month’s data. Thus, a stock is removed (no longer included in the portfolio) if it ceases to meet the initial criteria, and new stocks are added if they qualify. Note that we use these rules for backtesting purposes but do not necessarily advocate them as part of a real-world investing framework. Stocks that no longer qualify are dropped even if the strategist behind a particular approach suggests different sell rules versus buy rules. This may shorten the holding period and increase the turnover relative to what the strategist would suggest for an actual portfolio.
The stock screening strategies presented here are educational tools designed to illustrate how different filters and strategies perform under various market conditions. They are not portfolios or buy recommendations. Instead, view them as idea generators and conduct thorough analysis before committing real capital. Because market conditions change, it is also essential to maintain proper diversification.
Building a portfolio from a stock screen involves multiple steps. Beyond quantitative filters, investors must perform additional research to ensure a stock is a good fit. This includes qualitative analysis, such as reviewing earnings call transcripts, assessing management’s guidance and checking relevant company news. A stock passing a screen does not automatically make it a strong investment. Quantitative screening is just the starting point, and changing economic conditions can influence a strategy’s performance in the short term. Staying informed about market trends is critical.
To achieve effective diversification, consider stocks from multiple screening methodologies. However, selecting strategies based solely on long-term performance is not enough. It’s important to understand the factors driving both overall market trends and a strategy’s results, as well as how economic shifts can impact individual stocks. Examining a methodology’s characteristics can also highlight practical challenges when translating quantitative screens into real-world portfolios.
Lastly, remember that stock screening is a multi-step process. While quantitative filters help identify candidates with shared characteristics, they don’t guarantee strong investments. Investors must apply qualitative analysis to determine if a stock aligns with their portfolio goals. Combining quantitative tools with thoughtful research is key to building a well-rounded investment strategy.
AAII How-To

AAII Stock Ideas


JOHN L from NJ posted almost 2 years ago:
MANJUNATH S from CA posted almost 2 years ago:
PAUL G from NY posted over 1 year ago:
JEAN H from IL posted over 1 year ago:
BARRY J from TX posted over 1 year ago:
CHARLES R from FL posted over 1 year ago:
You need to log in as a registered AAII user before commenting.
Log InCreate an account