


Related

AAII How-To
The Vanguard S&P 500 ETF has surpassed the SPDR S&P 500 ETF in size. What does this shift mean for individual investors?
by Wayne A. Thorp | May 2025

Wayne Thorp leads a class in AAII's new Essential Investing Video Course. Go to https://www.aaii.com/ves for more information and to subscribe.
Among passive exchange-traded funds (ETFs) tracking the S&P 500 index, State Street’s SPDR S&P 500 ETF Trust  (SPY) has had the most assets under management (AUM) for the past 30 years.
In mid-February 2025, the Vanguard S&P 500 ETF (VOO) surpassed the SPDR S&P 500 in AUM. As of March 31, the Vanguard S&P 500 commands $590 billion, versus the SPDR S&P 500’s $576 billion.
What does this shift mean for individual investors? And, more importantly, does one fund deserve a place in your portfolio more than the other?
Using the Compare ETFs tool at AAII.com gives us a starting point for examining the similarities and differences between these two funds (Figure 1).
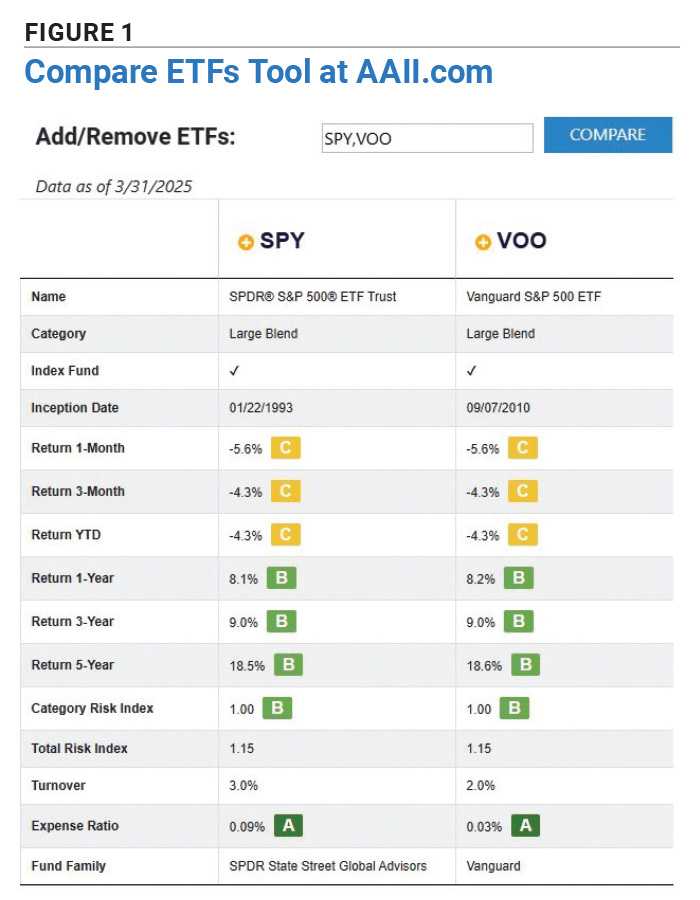
Both ETFs passively track the S&P 500 with near-perfect precision; therefore, they deliver virtually identical performance by design. As of March 31, 2025, the difference in their one-year and five-year annualized returns is a matter of mere basis points (bps). Their performance for the year to date and shorter periods is identical. Both funds consistently outperform their large blend category average by a little over one percentage point annually over five years, and both receive consistent A+ Grades of B across performance time frames of one year or more.
The performance parity makes the investor migration to the Vanguard S&P 500 particularly noteworthy since factors beyond basic return figures drive it.
Perhaps the most visible difference between these funds shown in Figure 1 is their expense ratios. While a 0.06% difference might seem trivial, it compounds significantly over time. On a $100,000 investment over 30 years (assuming 8% annual returns), the Vanguard S&P 500’s lower expense ratio would generate approximately $19,300 in additional wealth.
The Vanguard S&P 500 also maintains a slightly lower portfolio turnover at 2.0%, versus the SPDR S&P 500’s 3.0%, further enhancing its cost-efficiency advantage.
Despite both tracking the S&P 500, the two ETFs operate under fundamentally different legal structures that create meaningful advantages and disadvantages.
The SPDR S&P 500 operates as a unit investment trust (UIT), the oldest ETF structure dating back to its 1993 launch. This structure imposes significant limitations:
The Vanguard S&P 500, launched in 2010, employs a modern open-end fund structure that provides greater flexibility:
This structural difference extends to their management approaches as well: The SPDR S&P 500 has employed a team management approach since its inception, while the Vanguard S&P 500 has four dedicated managers with an average tenure of 2.6 years.
The Vanguard S&P 500’s flexible legal structure gives it distinct operational advantages that translate into real investor benefits. Its open-end fund structure helps reduce tracking error and enables securities lending—enhancing returns subtly but consistently. Also, its structure helps to minimize taxes relative to the SPDR S&P 500’s trust structure.
But despite the Vanguard S&P 500’s clear cost advantage, the SPDR S&P 500 maintains its dominance in one critical area: liquidity. The SPDR S&P 500 has an average daily volume (ADV) of approximately 71.3 million shares, compared to the Vanguard S&P 500’s 8.6 million shares.
Rather than declaring one ETF superior, it is important to recognize that the Vanguard S&P 500 and the SPDR S&P 500 serve different needs:
The SPDR S&P 500 excels for:
The Vanguard S&P 500 shines for:
AAII’s ETF Evaluator provides comprehensive analysis beyond basic cost comparisons for investors seeking deeper insights into these nuanced differences (Figure 2). It’s available to all AAII members and is accessed by typing an ETF’s ticker symbol into the Search box at the top left on AAII.com. It includes performance grades across multiple time frames, detailed risk metrics, portfolio composition, and trading volume and liquidity statistics.
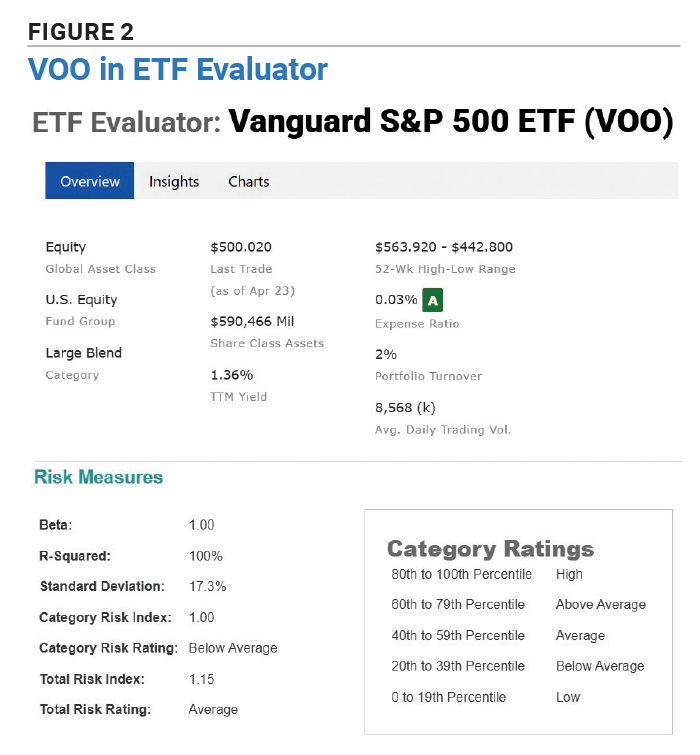
From a risk perspective, the two funds can show minimal differences at times. With data as of March 31, 2025, they share a standard deviation of 17.3% and a category risk index of 1.00. Their total risk indexes are also the same at 1.15, an “average” risk rating compared to all large blend ETFs.
The ETF Evaluator reveals the Vanguard S&P 500’s slight tax advantage, with a five-year tax-cost ratio of 0.5%, versus the SPDR S&P 500’s tax-cost ratio of 0.6%. This indicates that the Vanguard S&P 500’s structure may provide modest but meaningful tax benefits for investors in taxable accounts through more efficient handling of portfolio gains and dividends.
Despite their structural differences, both funds maintain nearly identical portfolios: just over 500 securities and a top 10 holdings concentration of around 34%.
AAII members who subscribe to A+ Investor, including AAII Platinum members, can compare detailed data on all ETFs that track the S&P 500 through the ETF Screener. Simply create a screen of large blend index funds and export the results. Open in a spreadsheet and sort by index tracked. Currently, there are five other ETFs that track the S&P 500, plus additional ETFs that track a subset of the S&P 500 based on characteristics such as quality, economic moat or sustainability.
AAII How-To

PRISM Wealth-Building Process

Mutual Funds

DANIEL M from TX posted over 1 year ago:
Wayne T from IL posted over 1 year ago:
You need to log in as a registered AAII user before commenting.
Log InCreate an account