

Related

AAII Sentiment Investing
Volatility refers to the magnitude of movement instead of a single direction; AAII founder James Cloonan encouraged investors to focus on “real risk.”
by Charles Rotblut | June 2025

Charles Rotblut leads a class in AAII's new Essential Investing Video Course. Go to https://www.aaii.com/ves for more information and to subscribe.
Volatility returned to the stock market this year in a big way.
The S&P 500 index lost 18.9% of its value in a period of just seven weeks between the middle of February and early April 2025. It then needed just five weeks to rebound to breakeven for the year.
Accompanying these large swings have been big daily moves. The S&P 500 experienced five days with a daily change of more than 3%: two up and three down in April and May. The last time the S&P 500 experienced a daily change that big was on November 10, 2022, when it gained 5.5%.
Volatility is regularly perceived in a negative light. Yet, volatility is not the same as direction. Here’s how Merriam-Webster’s Collegiate Dictionary defines it: “The quality or state of being volatile: such as a tendency to change quickly and unpredictably.”
A volatile stock, market or other financial instrument is one that incurs a big change in its value over a short period of time. The change in value can either represent a gain (upside volatility) or a loss (downside volatility). The value can also swing back and forth in a significant manner—just like the S&P 500 has done so far in 2025.
Volatility is tied to risk because large downward price moves can result in a shortfall when withdrawals need to be taken. Sudden, sharp drops also unnerve investors. Evolution has made humans averse to losses.
“Losses matter more than gains,” Nobel laureate Daniel Kahneman explained to me at a conference in 2018. “If I’m facing a 50% chance to lose $100 and a 50% chance to gain $150, then the loss of $100 weighs more than the gain of $150.”
Since volatility refers to the magnitude of movement instead of a single direction, AAII founder James Cloonan encouraged investors to focus on “real risk.” “My view of real risk is not short-term volatility but rather the possibility that the assets we expected to have for consumption will not be there when we need them,” wrote Cloonan in his final book, “Investing at Level3” (AAII, 2016).
Most of us know volatility when we see it. A big move in a stock’s price or a 1,000-point move in the Dow Jones industrial average catches our attention.
In its simplest form, volatility is measured as the percentage change in an asset, index or portfolio’s price. A daily change of greater than 2% in the S&P 500 is considered a volatile move because it doesn’t frequently occur.
Standard deviation provides a better view of volatility than simple percentage changes do. Standard deviation indicates the amount by which returns varied around the average return over a period of time. The higher the standard deviation, the greater the volatility.
Standard deviation is calculated as the square root of the average of the deviations from the average, squared.
A downside of standard deviation is that it does not immediately tell you how much more volatile an asset is relative to an underlying benchmark. The risk index does.
The risk index uses a baseline value of 1.00, which denotes average risk, meaning the security or fund experiences the same level of volatility as the benchmark. Values above 1.00 indicate greater volatility than the benchmark. Conversely, values below 1.00 indicate less volatility than the benchmark. In simplified terms, the higher the risk index, the more likely the asset’s price is to experience more significant increases and declines than the underlying benchmark.
The risk index is calculated as:
Standard Deviation of Asset Returns ÷ Standard Deviation of Benchmark Returns
The formula uses a 36-month period of returns. This period is short enough to pick up current trends, but not so short that it picks up large momentary fluctuations.
Those who prefer a forward-looking measure of volatility for the stock market can use the CBOE Volatility Index (VIX). It measures expected stock market volatility over the next 30 days based on S&P 500 options prices.
The VIX is often referred to as a fear gauge since higher options prices signal fear, pushing the VIX up. Historically, spikes in the VIX have aligned with significant market downturns—meaning it reflects fear about high levels of downside volatility continuing.
Volatility varies by investment type, asset class and market. The bond markets experience lower volatility than the stock market. The stock market experiences less volatility than cryptocurrencies like bitcoin. The differences reflect a higher chance of incurring a loss on the amount invested.
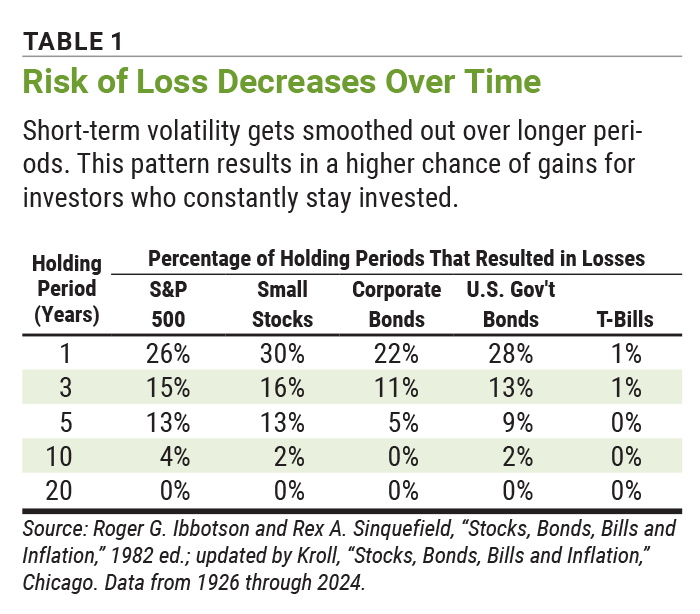
Volatility decreases as time horizon expands (Table 1). The S&P 500 has experienced a calendar-year loss approximately once every four years since 1926. The index rarely declined on a 10-year basis—just four times out of the last 90 periods.
Since the Great Recession of 2007 to 2009, the S&P 500 has most often realized a daily change of less than 1%. The large-cap index averages just 59 days per year with a gain or loss greater than 1%. Days with 2% moves are less common. The 15-year average is just 15 days per year between 2009 and 2024. The median is much lower at just seven days per year.
There is a clustering effect among the days with the most volatility. The days with the biggest upward spikes in the S&P 500 occur soon after the biggest down days for the index, as Figure 1 shows. The big moves have tended to occur during major financial crises or periods with high headline risk such as the April 2, 2025, announcement of reciprocal tariffs being placed by the U.S. on countries and territories across the globe.
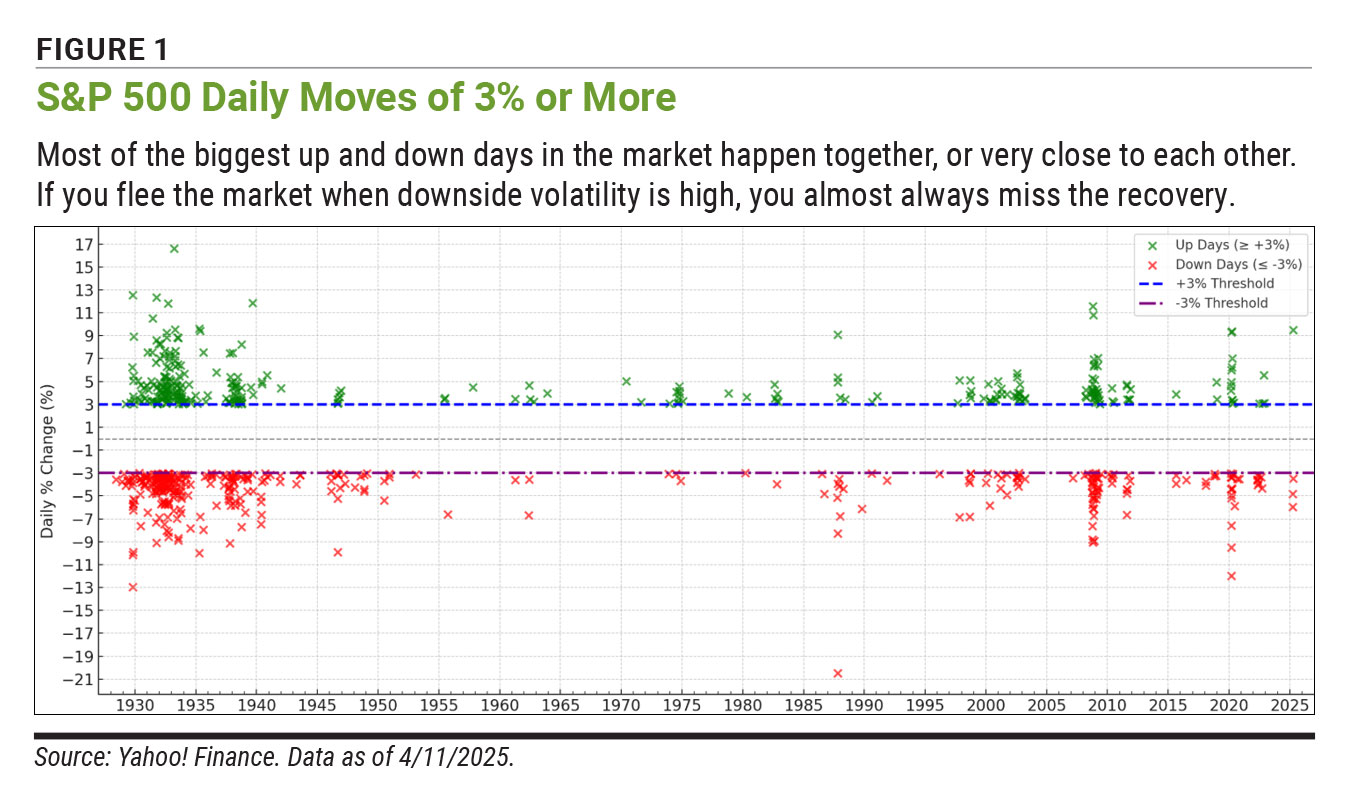
Between these large moves are often long periods of average or below-average levels of stock market volatility. Investors who do not panic in the face of downside volatility have historically been rewarded for their patience.
The simplest way for an investor to reduce their portfolio’s volatility is to hold different asset classes. Stocks and U.S. Treasury bonds are uncorrelated over long periods of time, meaning they move independently of each other. Adding in other asset classes such as gold can increase diversification and reduce volatility.
There is some trade-off though. Diversifying across asset classes in order to lower your portfolio’s volatility comes at the cost of reducing your potential long-term absolute returns.
Regardless of how much you allocate to a given asset class, it makes sense to diversify. One way to diversify among stocks is by style. Growth stocks tend to experience different returns than value stocks. Similarly, small-cap stocks don’t move in lockstep with large-cap stocks. A second way is to diversify by sector and industry. Information technology stocks and consumer staples stocks tend to work well as diversifying agents relative to each other.
Beyond such approaches, looking at the market and your portfolio less often will reduce the amount of volatility you perceive as occurring. Our emotions are significantly influenced by the most recent information we receive. By looking at your portfolio less, the short-term swings in its value will not be as noticeable. This, in turn, will better enable you to sleep soundly at night.
AAII Sentiment Investing

Portfolio Strategies

Financial Planning

ROBERT A from NC posted over 1 year ago:
BARRY J from TX posted over 1 year ago:
CHARLES R from IL posted over 1 year ago:
ROBERT A from NC posted over 1 year ago:
You need to log in as a registered AAII user before commenting.
Log InCreate an account