Understanding the VIX: A Practical Guide

The VIX is a widely watched metric that tracks expected volatility in the stock market. How you can use it to gauge potential market turning points.

Wayne Thorp leads a class in AAII's new Essential Investing Video Course. Go to https://www.aaii.com/ves for more information and to subscribe.

  • How the VIX is calculated to serve as a measure of market volatility
  • Spikes in the VIX may signal market downturns and investing opportunities
  • Practical strategies for using the VIX to assess market sentiment and possible turning points

The stock market is full of uncertainty, and if you’ve been investing for a while, you’ve likely experienced moments of extreme market swings. Some days, everything seems to be climbing steadily, while on others, volatility sends stocks tumbling. What if you could predict the next market meltdown before it happens? Imagine knowing when fear is at its peak—just before a massive rebound. That’s exactly what the CBOE Volatility Index (VIX) aims to do.

Often called the “fear gauge,” the VIX is a widely watched metric that tracks expected volatility in the stock market. But while many investors have heard of it, few know how to interpret it or use it in their investing strategy.

Let’s break down the VIX, how it works and how to apply it to make more informed investment decisions.

What Is the VIX?

The VIX measures expected stock market volatility over the next 30 days based on S&P 500 index options prices. Higher options prices signal fear, pushing the VIX up; lower prices suggest stability, bringing the VIX down.

Options give investors the right to buy or sell an asset at a preset price by a specific date in the future. When the price of the asset (the S&P 500 in this case) is expected to be more volatile, the odds of the option contract being exercised increases. Expectations for decreasing volatility make the option contract less likely to be exercised and thereby less volatile.

  • A low level for the VIX—typically below 15—suggests investor confidence and a stable market.
  • A high level for the VIX—above 30—indicates heightened uncertainty and potential market turmoil.

How Has the VIX Reacted in Recent Market Events?

Historically, spikes up in the VIX have aligned with significant market downturns:

  • The Great Recession of 2008: The VIX soared above 80 as panic selling took over.
  • 2018 “Volmageddon”: A sudden rise in the VIX led to a collapse in volatility-linked products.
  • 2020 Pandemic Crash: The VIX hit an all-time high of 82.69 in March 2020.
  • 2022 Bear Market: As inflation fears and Federal Reserve interest rate hikes rattled markets, the VIX consistently spiked above 30.

Investor Takeaway: The VIX reflects investor fear. Sharp spikes often signal major bottoms, while extremely low levels suggest complacency and potential pullbacks.

Interpreting the VIX

Figures 1, 2 and 3 plot the daily S&P 500 (stock market performance; top section of charts) against the VIX (market volatility index; bottom section) since 2007. The charts show how investor sentiment shifts in response to major market events. Here’s how to interpret the VIX using specific points in time from the charts.

Inverse Relationship: The VIX Spikes When the Market Drops

March 2020 (Pandemic Crash): The S&P 500 plunged rapidly as global lockdowns sparked panic selling. As shown in Figure 1, the VIX soared above 80, signaling peak investor panic—a historically strong buying opportunity. Contrarians who bought stocks during this period saw major gains in the recovery rally that followed.
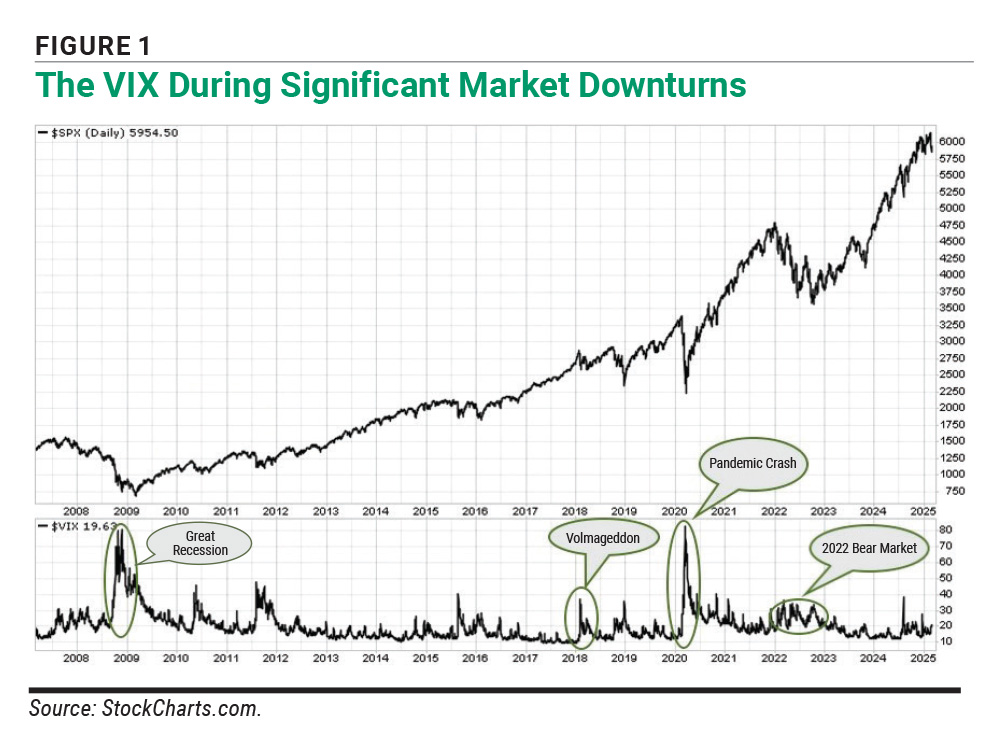
Figure 1 The VIX During Significant Market Downturns

October 2008 (the Great Recession): In the depths of the financial crisis, investors dumped stocks in sheer panic. The VIX exploded past 80—one of its highest readings ever—signaling extreme fear. Those who dared to buy at this moment saw massive gains as markets rebounded.

Market Stability: Pullbacks Preceded by Periods of Low Volatility

Late 2017 to Early 2018 (Pre-Volmageddon): The VIX stayed below 12 for an extended period, signaling market complacency. In February 2018, a sudden VIX spike coincided with a sharp S&P 500 pullback (Figure 2). The spike caused short-term volatility exchange-traded products to lose more than 90% of their value, leading to the term Volmageddon.
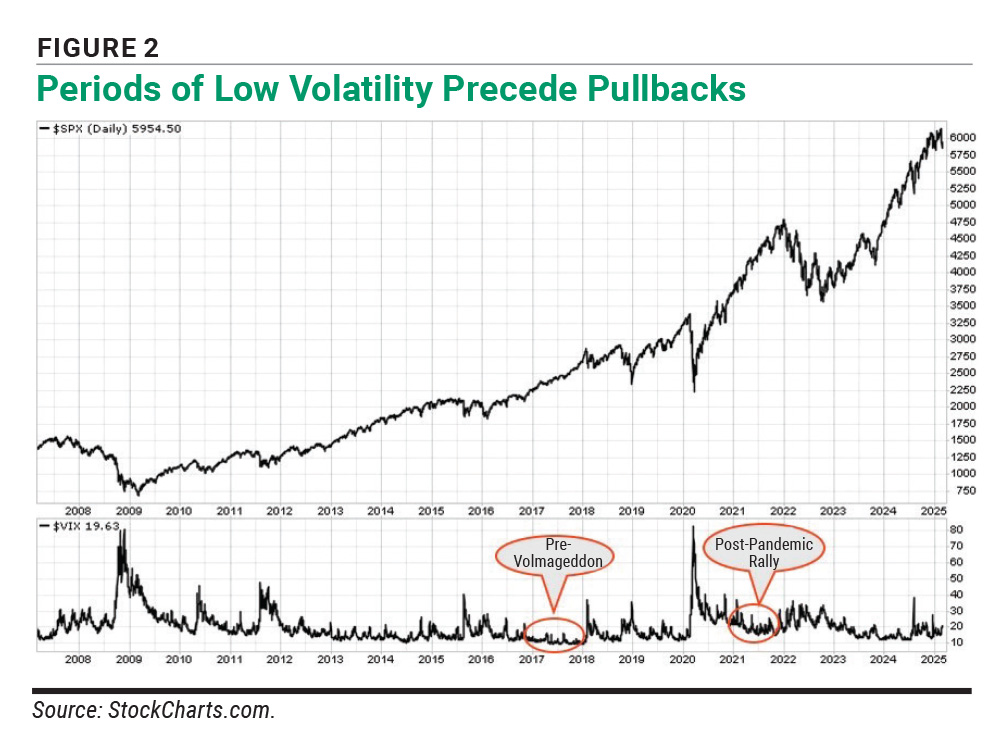
Figure 2 Periods of Low Volatility Precede Pullbacks

Mid-2021 (Post-Pandemic Rally): The S&P 500 was climbing steadily, while the VIX remained suppressed around 15. By early 2022, inflation fears and interest rate hikes triggered a sell-off, proving that prolonged low volatility doesn’t mean risk-free markets.

Early Warning Signals: The VIX’s Gradual Rise Before Market Sell-Offs

August 2015 (China’s Market Crash and Flash Crash): The VIX started rising in mid-2015, even before the S&P 500 sell-off in August (Figure 3). Investors paying attention to this early uptick in the VIX could have adjusted their portfolios ahead of the downturn.
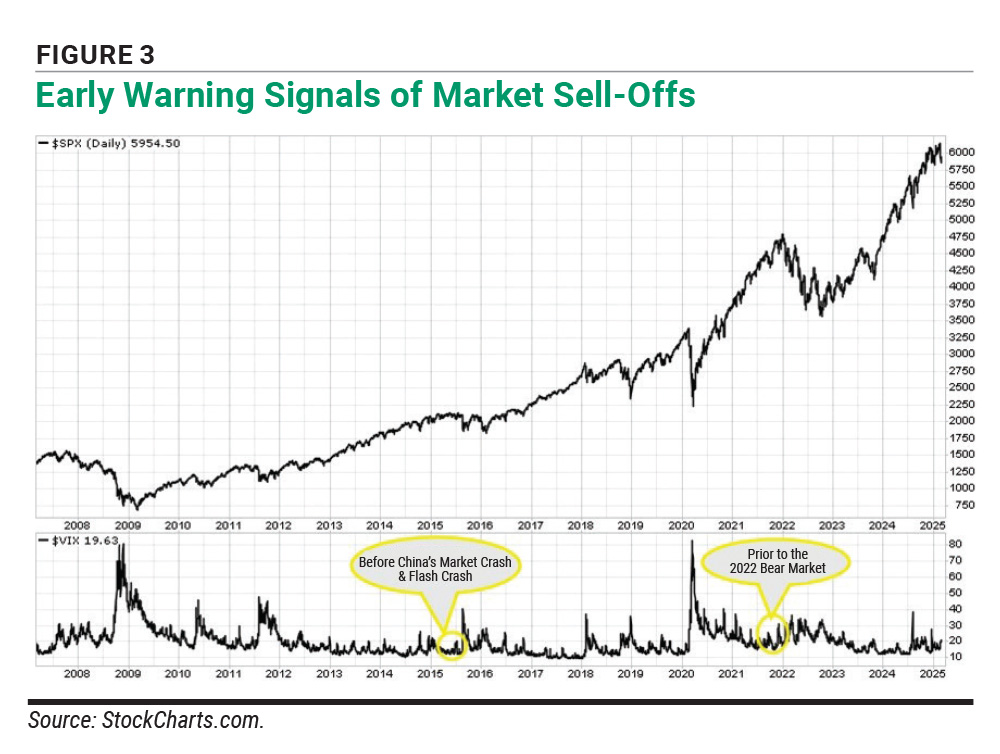
Figure 3 Early Warning Signals of Market Sell-Offs

Late 2021 (Prior to the 2022 Bear Market): The VIX trended slightly upward in late 2021, hinting at increasing uncertainty as inflation concerns grew. By early 2022, markets reacted violently, leading to a significant bear market decline.

VIX Futures & Trend Signals: When to Be Cautious or Opportunistic

March 2009 (Recovery Begins After Great Recession): The VIX gradually declined from its peak, while the S&P 500 found a bottom and started recovering. This confirmed that fear was subsiding, and long-term investors who bought in at this point were rewarded in the following years.

October 2022 (Bear Market Bottoming Process): The VIX spiked above 30 multiple times throughout 2022, reflecting fear as markets adjusted to aggressive interest rate hikes. By fourth-quarter 2022, the VIX began declining, indicating that market sentiment was stabilizing, leading to the bullish recovery of 2023.

Takeaways From the Charts

VIX Spikes = Investor Fear: October 2008, March 2020 and October 2022 illustrate that major market bottoms often happen when the VIX reaches extreme highs.

Low VIX ≠ Risk-Free Markets: 2017 and 2021 show that a prolonged low VIX can precede corrections when complacency builds up.

Rising VIX Can Be a Warning Signal: August 2015 and late 2021 demonstrate that a gradually increasing VIX can signal upcoming market stress.

How to Use the VIX in Your Investing Strategy

The VIX’s most significant value lies in understanding investor emotions to gauge market sentiment. Generally:

  • When the VIX is high, fear dominates and markets are often at or near a bottom.
  • When the VIX is low, complacency sets in, and markets may be at risk of a pullback.

A common contrarian approach is to buy when fear is high (VIX spikes) and be cautious when complacency dominates (VIX is low).

Investor Takeaway: A high VIX isn’t necessarily bad—it can present buying opportunities when fear is excessive.

The VIX and Market Timing

Research on the term structure of VIX futures suggests that the way VIX futures are priced can provide additional signals about market direction. Here’s what to watch:

  • Contango (Upward-Sloping VIX Futures Curve): This is when long-term VIX futures trade at higher prices than short-term ones. It often signals a continuation of a bull market as investors expect near-term volatility to be lower than future volatility.
  • Backwardation (Downward-Sloping VIX Futures Curve): This occurs when short-term VIX futures are priced higher than long-term ones. It often suggests that a market correction or bear market is underway, and volatility is expected to remain elevated over the near term and fall in the future.

Think of VIX futures like airline tickets. If flights for next year cost more than flights for next month, it means that people expect future demand (and volatility) to rise—this is contango. But if last-minute flights surge in price while future ones remain cheap, it means demand is spiking now—this is backwardation.

Investor Takeaway: When the VIX futures term structure flattens or inverts, it may signal a market turning point—a potential warning sign for stock investors.

Common VIX Misconceptions

  • Myth #1: A high level for the VIX always means a market crash is coming.
    Reality: A high level for the VIX often signals market bottoms, not crashes.
  • Myth #2: A low level for the VIX guarantees smooth markets ahead.
    Reality: A low level for the VIX can signal complacency, which sometimes precedes a pullback.

Investor Takeaway: Don’t assume the VIX predicts exact market moves—it is a tool for gauging sentiment.

The VIX Is a Tool, Not a Crystal Ball

The VIX is a valuable indicator of market sentiment and potential turning points, but it should never be used in isolation. Instead, consider it one piece of a broader investing strategy that includes fundamental analysis, asset allocation and risk management.

Key Takeaways:

  • The VIX measures market volatility expectations—higher levels signal fear, while lower levels suggest complacency.
  • Historically, the VIX moves in the opposite direction of the market—spiking during downturns and falling during stable periods.
  • The shape of the VIX futures curve (contango vs. backwardation) can provide clues about market direction.
  • Using the VIX as part of a broader investing strategy—whether for risk management or identifying opportunities—can help investors navigate uncertainty.

The VIX is more than just a number—it’s a signal. The next time the VIX spikes or drops, don’t just watch. Instead, ask yourself: Is the market panicking? Is complacency setting in? Use this tool to position yourself ahead of the crowd. 

Discussion

ROBERT A from NC posted over 1 year ago:

Oh, great: a "tool" for market timing. And a great way to lead astray gullible investors who are looking to AAII for HELPFUL guidance. I love that last sentence: "Use this tool to position yourself ahead of the crowd." Sure, using tealeaves like this to direct your investing, you can be the first to go broke.


Wayne T from IL posted over 1 year ago:

@Robert, as always, I appreciate your feedback. However, let’s be clear: the VIX is not a "tealeaf," and using it responsibly is not “market timing”—it’s understanding market sentiment, a legitimate and well-established pillar of behavioral finance. The VIX, created by the CBOE and widely followed by institutional investors, is a real-time index that reflects expected volatility over the next 30 days, derived from S&P 500 option prices. It doesn’t predict market direction but provides insight into investor fear and complacency. Ignoring that data isn't prudent; it’s willful blindness. AAII does not suggest that individual investors discard their long-term plans and start day-trading volatility. We are educating members on tools that professionals use daily to assess risk conditions. If you believe investors should only focus on long-term fundamentals while ignoring all signals from investor psychology and volatility pricing, you’re advocating an incomplete approach to modern investing. The line you mocked—“Use this tool to position yourself ahead of the crowd”—is not hype. It reflects the core purpose of AAII: to help individual investors make informed decisions, understand institutional behavior, and avoid being caught unaware when fear spikes and liquidity vanishes. Knowing what the “crowd” is afraid of and how much they’re willing to pay to protect against it is actionable data. And yes, it can help you make better timing decisions. Not to speculate, but to rebalance, hedge, or reduce risk exposure. Lastly, let’s not insult our members by calling them "gullible." Education is empowerment. We trust our community of investors to discern hype from insight, especially when that insight comes with decades of academic and market validation behind it. Thanks for reading!


BARRY J from TX posted over 1 year ago:

Wayne, remember, Perry White always gave the tough assignments to Clark Kent. #1 Here are my non-X-Ray views on the VIX market indicator. It is derived from trading volumes. Markets do what all markets do – they brings sellers and buyers together to trade. In this case it’s futures options contracts that provide a way to leverage buy/sell bets. #2 VIX does everything you describe in the multiple lists of recent examples of VIX outlier events in your article that you use to defend VIX. #3 Like all markets, some of the larger VIX participants (hedge funds, market makers, etc.) try to “influence” market outcomes in their favor by temporarily creating nuanced overbought or underbought positions. #4 Large database computerization has amplified the ability to do this. VIX was launched in 2004 to address mounting market issues since the 1987 crash, LTCM collapse, and issues behind the 2000-2001 dot com market crash. The last 20 years (2004-2024) have seen a higher frequency and larger amplitudes of VIX. The 2018 Volmageddon is just 1 of 15 or so VIX “spikes” I counted in this article. Your lists of VIX outlier events since 2004 suggest a shortening of the “mean time between failures” – a statistical tool that seeks to measure the overall frequency and velocity in systems defects over time -- in markets since VIX went on line. #5 A newer ilk online brokers and “investors” has attracted a whole new generation of “day traders” that BELIEVE that object of the “investing game” is to MANIPULATE markets using any mechanism available. Some of their favorite tools are “programmed trading,“ Reddit forums, ,AI , and, now Chatbots. #6 When you say “it [VIX] can help you make better timing decisions. Not to speculate, but to rebalance, hedge, or reduce risk exposure” you are being as naïve as Clark Kent when he seeks “Truth, Justice, and the American Way.” #7 It precisely during times of VIX movements that “volatility” moves the most and the price spreads increase. It is during these times (like the current market) when reporters become born-again VIX experts. The attention they focus on the power of VIX increases. Uninitiated investor “moths” are drawn to the heat of the VIX inertia. Eventually VIX “corrects to the mean” like all markets, but no before the VIX “market movers” “wet their beaks.” #8 I think the data you review here suggests that the percent of market participants who are interested in “shifting” market trends in their favor has increased. To many of them options are just the “big money” table in the casino where the rules are loser. #9 There is ample messaging traffic on the AAII Communities offering to suggest that some AAII members want to learn how to and believe then can “beat the house” using options trading. This is a recent and increasing trend. A chacun a truc, mon frere. #10 I am just a Jimmy Olsen level cub reporter. But he was even naive enough to help Superman see who the bad guys were and what they were up to.


Wayne T from IL posted over 1 year ago:

@Barry Thanks for the thoughtful response—and the Perry White nod. You’ve raised several essential points about market behavior, manipulation, and structural change, but let’s ground this conversation in data and history. First, the core function of the VIX, as outlined in my article, is not to predict markets in the deterministic way you suggest some expect it to. It reflects expected 30-day volatility in the S&P 500 based on real-time index option pricing, not volume, and not investor conspiracy theories. As I wrote: “The VIX measures expected stock market volatility over the next 30 days based on S&P 500 index options prices.” You cite increased frequency and amplitude of VIX spikes since its 2004 revision, but that’s precisely why it’s become more relevant for risk-aware investing. In fact, we’ve seen that spikes in the VIX consistently align with major market bottoms, including: • October 2008 during the Great Recession (VIX > 80) • March 2020 at the pandemic crash peak (VIX = 82.69) • October 2022 during inflation-fueled selloffs (VIX > 30) Those aren’t random “failures” of the market—they’re clear indicators of investor panic that were, in hindsight, contrarian buy signals. That’s the point of the article: to demystify the VIX as a sentiment gauge, not to glorify it as a predictive engine. Regarding market manipulation: Yes, hedge funds and large players exist, but every VIX level is the sum of countless pricing decisions in real-time options markets. That decentralized data is hard to fake over time. Importantly, market structure itself offers early warnings. The gradual rise of the VIX in late 2021, for example, foreshadowed the 2022 bear market before prices declined. You suggest that newer, more aggressive retail behavior (via Reddit, AI, chatbots) has distorted markets. Possibly. However, your own logic supports why the VIX remains so useful—it captures shifts in sentiment across all market participants. Whether driven by fear or FOMO, it measures what's priced in, not what people say on message boards. As for the idea that VIX spreads widen “precisely during volatility,” yes, that’s literally how volatility pricing functions, and it’s a feature, not a flaw. That’s why the VIX futures term structure offers cautionary or opportunistic clues: • Contango often signals continued market calm. • Backwardation suggests stress and potential correction. To close: Your Jimmy Olsen analogy is charming, but the VIX isn’t about capes and villains. It’s about recognizing patterns of sentiment at extremes, when fear is irrational and opportunity is often most significant. You say “the house” always wins, but as the data shows, those who bought in when the VIX spiked, not when it was low, were the ones who came out ahead. So yes, Clark Kent may be a bit idealistic, but in volatile markets, clarity isn’t naïve, it’s necessary.


ROBERT A from NC posted over 1 year ago:

Wayne, you've certainly provided an excellent essay based on textbook conventional wisdom. Nice deflection, but I'm not calling AAII members "gullible" --- only those who blindly follow such conventional wisdom. I wonder, does Warren Buffett use the VIX to "rebalance, hedge, or reduce risk exposure"? I know I've never used the VIX, never "rebalanced," never "hedged," and never sought to reduce VOLATILITY exposure (which is, I take it, what you mean by "risk exposure"). Sorry, but I take a very dim view of any "tool" that claims to predict short-term market movements. To me it's still a bunch of tealeaves. I agree with Charles Rotblut's statement in "Market Corrections Offer Opportunities" from this edition of the Journal: "Investors who stick to disciplined strategies and are unfazed by market volatility achieve the highest long-term returns." I could throw in a couple of quotes from James Cloonan, but I hope I've made my point.


Wayne T from IL posted over 1 year ago:

@Robert I appreciate the continued dialogue. You approach markets through your own lens. However, AAII serves a broad range of investors, each with their own discipline, time horizon, and appetite for tools. Just to clarify one point: You say you’re not calling members “gullible,” only those who follow “conventional wisdom” blindly. But that distinction still implies that investors who find value in sentiment indicators like the VIX are being misled. I respectfully disagree, and I trust AAII members to discern insight from noise, which is precisely why we present tools like this with education and context, not hype. As for Warren Buffett, no, he probably doesn’t use the VIX. But he also doesn’t suggest ignoring market psychology. Some of his most famous advice, “Be greedy when others are fearful,” is rooted in sentiment awareness, which is precisely what the VIX helps quantify. It doesn’t predict market direction. It reflects what investors are pricing in as risk. That’s a signal, not speculation. If you prefer to tune out that signal, that’s your prerogative. However, for members who want to better understand how sentiment shapes opportunity and risk, it’s not just “tea leaves.” I prefer to call it informed perspective.


ROBERT A from NC posted over 1 year ago:

Wayne, one more little passage and I will shut up. In your initial response, you suggested that I'm being imprudent and "willfully blind" for ignoring the VIX. Yet I've been quite successful investing in much the same way James Cloonan, Warren Buffett, and a host of other successful investors have achieved wealth: by ignoring volatility and taking a long-term view. (By the way, neither Buffett nor I need the VIX to tell us when to be greedy.) Can you name some extremely wealthy investors who got that way trading IN THEIR OWN ACCOUNT based on VIX "signals"? Call it what you want, but in the absence of such investors, I do think it is misleading to suggest that the VIX is a useful tool for generating long-term wealth. There are prudent, time-tested ways to achieve wealth, and I don't think using the VIX as a "signal" falls into that category. If I'm wrong, then kudos to those rich sages who master the VIX. I won't cry for missing out on it. I understand that AAII members have differing investment philosophies, but that doesn't mean you're doing market-timers a favor by encouraging the practice.


Wayne T from IL posted over 1 year ago:

@Robert, to clarify: I never suggested that anyone invest solely based on the VIX, just as no one should invest exclusively based on ROE or P/E. My point is that dismissing the VIX entirely overlooks a potentially valuable data point about market sentiment. Buffett, Cloonan, and others built wealth by staying disciplined and long-term focused, not by reacting to volatility. I agree. But they also didn’t pretend market signals had no value. They simply knew which ones to filter out. I’m not saying the VIX is essential. I’m saying it’s not irrelevant. If it doesn’t fit your process, that’s fine. However, calling it useless misrepresents what it is and what it can be for certain investors.


BARRY J from TX posted about 1 year ago:

Wayne, thank you for your courtesy and the depth of your response. #1 AAII is one of the few forums that diligently tries to promote dialogue among members. You educated me on VIX and I respect your time and effort. That's why I am an AAII member --to learn. #2 I guess I am like Clark Kent, too. I see villains everywhere because I see so many promotions that some person or organization has an "edge" ... they will sell to me ... everyone else. Yet none of these "touts" maintains whatever "edge" they allege they possess. #3 Unrelated comment. The lack of responses to AAII articles bemuses me. I came to learn, but I also understand the value of contributing and getting feedback. As I have said repeatedly, the other AAII member who DO TAKE time to respond continually educate me. #4 I am a wiser and wealthier man from my AAII experiences and staff and member comments.


Wayne T from IL posted about 1 year ago:

@Barry Your note truly means a lot. Thank you for taking the time to respond with such candor and reflection. I’ve always believed that AAII’s greatest strength isn’t just the research or the tools. It’s the community. Members like you, who come to learn and contribute, make this more than just another financial publication. Your comments, even when challenging, always push the conversation forward, and I’m grateful for that. I also really respect your honesty about the ever-present “edge chasers” in this space. It’s too easy to get swept up by the noise of new products and bold promises. Your ability to call out the disconnect between what’s marketed and sustainable is sharp and necessary. As for the quiet comment sections, I'm with you. Engagement fuels understanding, and the kind of back-and-forth you just modeled is exactly what keeps us all sharper. I hope others follow your lead. Most of all, I’m glad AAII has been a source of knowledge and growth for you. That’s the mission in a nutshell. Looking forward to hearing more from you in the next round of articles. —Wayne


JAMES L from TN posted about 1 year ago:

Although frequently stated as such by many/most authors and commentators, the VIX published reading does NOT equal the implied volatility over the next 30 days unless you do your own calculation to determine it for 30 days. The VIX published reading is based on the 30 day options data, that is true. However, the VIX is the 30 day calculation ANNUALIZED. It's similar to the GDP reading which is the recent quarter over previous quarter data ANNUALIZED. So, people who think that volatility is going to be that incredibly high over the next 30 days when it spikes to high numbers are never going to see that volatility in just 30 days. It would be a good thing if folks stopped implying and/or stating that the implication is that the market is going to possibly (implied) see that volatility in just 30 days. It is misleading and also annoying.


Wayne T from IL posted about 1 year ago:

@James You're right to point out that the VIX is an annualized 30-day implied volatility metric, not a raw forecast of 30-day market movement—and I appreciate you highlighting that distinction. That said, the article intentionally simplifies the concept to focus on how the VIX reflects near-term sentiment shifts, not to imply that a VIX reading of 30 equals a 30% move in the next month. Your comparison to GDP annualization is a helpful one: just as a 4% GDP print doesn't mean 4% growth in a quarter, a VIX of 30 doesn’t suggest 30% volatility in a month. It reflects a roughly 8.66% expected standard deviation over that 30-day period, scaled to an annual rate. But here’s the key point: most investors—even experienced ones—use the VIX directionally, not statistically. They’re looking at changes in risk sentiment, not running the underlying math. The article's language is accurate for its intended audience and purpose: to educate investors on how the VIX signals fear and complacency, not to serve as a technical breakdown of implied volatility modeling. In short, your clarification is valid for those who want the full technical detail. However, the article remains factually correct, practically useful, and in line with how the VIX is explained across both professional and retail investor platforms.


JAMES L from TN posted 12 months ago:

But the article does imply/suggest that it will potentially as implied move 30% over the next 30 days and that is my entire point! And your reply correctly does not state that as it incorrectly states it in the article, your reply states it correctly just as I noted and described in my comment - Thank You. The essence of my comment and your reply comment should be reflected in the article to make things all square and fully correct and not mislead readers that understand common English such as "over the next 30 days". All else I agree with.


Wayne T from IL posted 12 months ago:

@James I appreciate the follow-up. I understand your concern about how some readers might interpret “over the next 30 days” too literally in terms of magnitude, rather than timeframe. While the article was written for accessibility and aimed at practical interpretation—not technical volatility modeling—I agree that future versions can be more precise in that phrasing. That said, I think most readers understand that VIX values are not direct forecasts of market movement, but rather gauges of expected annualized volatility derived from options pricing. Still, your clarification helps reinforce that distinction, and I’ll keep that in mind for future content. Thanks again for your engagement. I'm glad we’re aligned on the broader points.


JAMES L from TN posted 12 months ago:

For readers who want to know the actual and true meaning of the published VIX value, this is how the article statement could/should read: The VIX measures expected stock market volatility over the next 30 days based on S&P 500 options prices AND THEN ANNUALIZES THAT NUMBER FOR THE PUBLISHED VIX VALUE. I would prefer not to get novice investors off on the wrong foot with verbiage as stated in the article which is false and misleading because it is not a correct and complete statement of the process for determining the VIX value. If corrected, then we would be aligned on an important fact of an important calculation.


You need to log in as a registered AAII user before commenting.
Create an account

Log In

Get your free copy of our special report analyzing the tech stocks most likely to outperform the market.

Download the FREE Report Here: