

Related

AI-Powered Investing
Understanding how financial statements influence valuation measures helps you spot both positive and negative changes.

Charles Rotblut leads a class in AAII's new Essential Investing Video Course. Go to https://www.aaii.com/ves for more information and to subscribe.
Valuation ratios help you determine whether a stock’s share price is cheap, reasonable or expensive. Each valuation ratio is tied to one or more of the three financial statements: the balance sheet, the income statement and the cash flow statement.
The financial statements show you both a company’s fiscal trends as well as changes in dividends and shares outstanding. The last metric affects most valuation measures: Reductions in the number of outstanding shares raise the ownership percentage of each remaining share. Increases in the number of outstanding shares have the opposite effect.
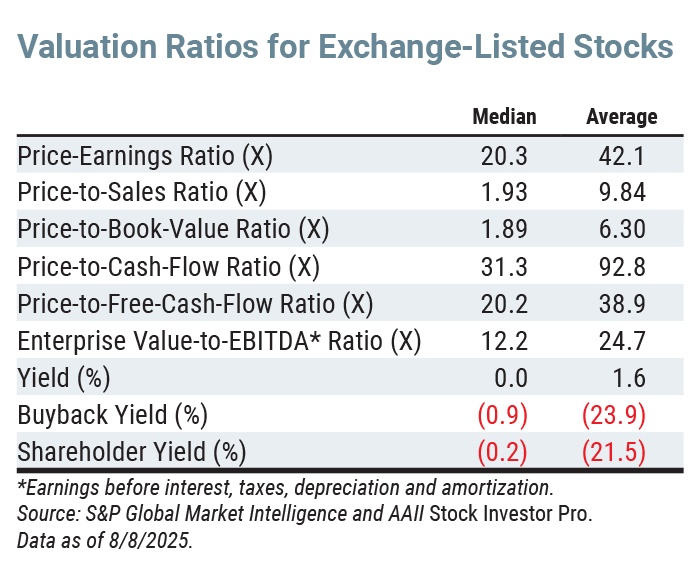
In this installment of our financial statement analysis series, we show you how the financial statements impact nine key valuation ratios.
The income statement keeps score of a company’s performance and provides a basis for many valuation ratios.
The price-earnings (P/E) ratio is the most used measure of valuation. It is calculated by dividing the current stock price by diluted earnings per share from continuing operations over the trailing 12 months. It ties valuation directly to earnings. As of mid-August 2025, the median price-earnings ratio for all exchange-listed stocks is 20.3; the average is 42.1.
Investors are willing to accept a higher price-earnings ratio if they think earnings will be higher in the future. Lower price-earnings ratios reflect expectations for lower growth or a decline in profitability.
The denominator of the ratio, earnings, reflects the influences of the entire income statement: revenues, cost of sales, operating expenses, interest expenses and taxes.
Revenue growth combined with stable profit margins increase earnings and lower the price-earnings ratio, if the stock price remains constant. Conversely, declining earnings push the ratio higher, if the stock price stays stable.
One-time events (e.g., a severe storm), charges and income can significantly distort earnings. Many investors use adjusted earnings that exclude such effects when calculating the price-earnings ratio. Corporate decisions regarding the recognition of revenue and earnings can also affect earnings and the price-earnings ratio.
The price-earnings ratio cannot be calculated if a company is not profitable.
Some investors prefer the price-to-sales (P/S) ratio because it is less susceptible to accounting and expense recognition timing decisions than the price-earnings ratio. The price-to-sales ratio is also helpful for valuing companies that either are not profitable or only realize small levels of profitability.
The denominator of the price-to-sales ratio is total revenue divided by the number of shares outstanding. The median price-to-sales ratio for all exchange-listed stocks is 1.93; the average is 9.84 as of mid-August 2025.
Revenue growth increases the ratio’s denominator (sales) and lowers the price-to-sales ratio if the stock price remains unchanged. Growing companies become cheaper on a price-to-sales basis over time if their share prices rise at a slower pace than their revenue growth.
Changes in the mix of products sold at high or low price points can impact revenues, as well as profitability. Shifts in the mix of licensing and subscription revenue relative to one-time sales also impact the price-to-sales ratio and earnings. Acquisitions can boost revenues, but a stock’s price-to-sales ratio may still fall if investors do not expect the merger to add to profit growth.
Unlike the price-earnings ratio, the price-to-sales ratio can be used to value unprofitable companies.
Whereas the income statement is an updated scorecard of a company’s performance, the balance sheet provides a snapshot in time of a company’s assets, liabilities and shareholder’s equity.
Value investors have long used the price-to-book-value (P/B) ratio to assess a company’s value. The ratio compares a stock’s current price to the net equity shareholders have in the company.
Book value is the common equity of a company—total assets less liabilities adjusted for any preferred equity outstanding. In theory, the price-to-book ratio calculates the premium (or discount) investors pay for the value of a company’s assets after all liabilities have been settled. The median price-to-book ratio for all exchange-listed stocks is 1.89; the average is 6.30 as of mid-August 2025.
Book value can fluctuate from quarter to quarter or year to year due to timing issues. These include shifts in inventory, account payables, fixed assets and long-term debt. Some investors monitor retained earnings—profits realized but not spent or distributed—for a pattern of growth.
Analysis of the balance sheet is important when using the price-to-book ratio. Pay attention to any recent big changes in line items such as inventory, fixed assets and debt. They can help explain whether the change in valuation reflects expectations for improved business fundamentals or concerns about emerging trends.
Book value is mostly based on recorded accounting transactions and not the current market prices of balance sheet items. Book value also ignores the value of any network effect (e.g., a highly efficient distribution center), brand value, etc. Nonetheless, academic research has shown strong historical outperformance of portfolios comprising low price-to-book ratios.
The cash flow statement is the least affected by accounting choices. The cash flow statement is also unique in that it factors in transactions occurring on both the balance sheet and the income statement.
Cash flow is the sum of changes in cash from operations, cash from investing, cash from financing and exchange rate effects. The price-to-cash-flow-per-share (P/CFPS) ratio calculates a stock’s valuation based on how much cash a company has realized over a given period.
Rising levels of cash flow reduce the price-to-cash-flow ratio (make it cheaper), while falling levels increase it (make it more expensive). The median price-to-cash-flow ratio for all exchange-listed stocks is 31.3; the average is 92.8 as of mid-August 2025.
Three different financial categories impact the denominator (cash flow per share). Profitability, the receipt of payments by customers and spending on business operations affect cash from operations (CFO). Changes in capital equipment, related expenditures and investments drive cash from investing. Changes in debt levels, dividend payments and share repurchases or issuances determine cash from financing.
Companies without positive cash flow will not have a valid price-to-cash-flow ratio. Cash flow can be positive even if earnings are not.
The price-to-free-cash-flow-per-share (P/FCFPS) ratio differs from price-to-cash-flow ratio by considering only the cash not needed to be reinvested back into the company.
Free cash flow starts with cash flow from operations and subtracts both capital expenditures (capex)—listed in cash from investing—and dividends paid—listed in cash from financing. Capex is required to maintain, repair or replace machinery and facilities. It is also required to enable expansion. Once dividend payments start, shareholders expect them to continue.
It is not unusual to see free cash flow calculated as just cash flow from operations minus capex since the payment of dividends is not necessary for the business to operate. The median price-to-free-cash-flow ratio for all exchange-listed stocks is 20.2; the average is 38.9 as of mid-August 2025.
Improved working capital management—such as collecting receivables faster or managing inventory more efficiently—increases operating cash flow and lowers the price-to-free-cash-flow ratio. These improvements show up in the operating activities section of the cash flow statement.
Increased capital spending can cause the price-to-free-cash-flow ratio to jump to a high level or not become meaningful. The ratio cannot be calculated when free cash flow is negative. Investigate the cash flow statement if this happens. It could be a timing issue related to a sharp increase in capex, or it could reflect a large drop in cash from operations.
Enterprise value (EV) represents a company’s total value to all stakeholders, not just shareholders. This makes ratios based on enterprise value particularly useful for comparing companies with different capital structures.
Enterprise value is calculated as the sum of market capitalization, short-term debt, long-term debt and preferred equity minus cash. All the debt and cash figures come directly from the balance sheet.
Enterprise value is referred to as a company’s theoretical takeover price. An acquirer would have to take on the company’s debt but would pocket its cash. For this reason, some consider enterprise value to be more representative of a company’s value than market cap alone.
Earnings before interest, taxes, depreciation and amortization (EBITDA) comes from the income statement. It represents operating income with depreciation and amortization added back. EBITDA is often used as a proxy for cash flow, though the two are not same.
The median enterprise-value-to-EBITDA (EV/EBITDA) ratio for all exchange-listed stocks is 12.2; the average is 24.7 as of mid-August 2025.
The balance sheet influences enterprise value, with changes in debt and cash both affecting it.
EBITDA is influenced by a company’s profitability. Reviewing the income statement is key because differences in revenues, cost of goods sold (COGS) and general and administrative expenses all have an impact. Also, look for significant changes in depreciation and amortization.
The next set of ratios measure how much cash a company returns to shareholders through dividends and share repurchases. They connect directly to the financing activities section of the cash flow statement.
A company’s ability to continue returning cash to shareholders can be judged by looking at all three financial statements. A drop in profitability (shown on income statement) may give a company a reason to pause dividend increases or share buybacks. High debt levels on the balance sheet give a company less flexibility to return cash to shareholders. Ongoing negative operating cash flow can cause a company to cut or suspend its dividend.
Dividend yield is calculated as the indicated annual dividend per share divided by the current stock price. The indicated dividend is the cumulative per-share dividend a company expects to pay over the next four quarters. It is typically calculated by multiplying the latest per-share dividend paid by four.
Total dividend payments are reported in the financing section of the cash flow statement.
Dividend yields move inversely to a stock’s price. Rising stock prices reduce the dividend yield (resulting in a more expensive valuation), while falling stock prices increase the dividend yield (resulting in a less expensive valuation). Dividend increases raise the yield if the stock price remains constant. The median dividend yield for all exchange-listed stocks is 0.0%; the average is 1.6%.
The buyback yield measures the percentage reduction in shares outstanding in the most recently reported quarter relative to the same quarter one year earlier. The number of shares outstanding is listed in the income statement.
Dollars spent on repurchasing shares are listed in the financing activities section of the cash flow statement. Repurchased shares may be added to a company’s treasury stock on the balance sheet or retired at the company’s discretion.
The buyback yield can be a more volatile measure of valuation because it is directly impacted by changes in the number of shares repurchased in a given quarter. The buyback yield can be positive or negative. A positive buyback yield indicates a net decrease in the number of outstanding shares, whereas a negative buyback yield represents a net increase. The median buyback yield for all exchange-listed stocks is –0.9%; the average is –23.9%.
Shareholder yield is the sum of the buyback yield and dividend yield.
Shareholder yield is the only other valuation ratio listed here that can be positive or negative. A positive shareholder yield signals that the company has returned cash to shareholders on a net basis. A negative shareholder yield occurs when the buyback yield is more negative (e.g., –5.0%) than the dividend yield is positive (e.g., +1.5%). The median shareholder yield for all exchange-listed stocks is –0.2%; the average is –21.5% as of mid-August 2025.
Price-Earnings (P/E) Ratio
Formula: Stock Price ÷ Diluted Earnings per Share
Influences and Considerations:
Price-to-Sales (P/S) Ratio
Formula: Stock Price ÷ Sales per Share (12 months)
Influences and Considerations:
Price-to-Book-Value (P/B) Ratio
Formula: Stock Price ÷ Book Value per Share
Influences and Considerations:
Price-to-Cash-Flow-per-Share (P/CFPS) Ratio
Formula: Stock Price ÷ Cash Flow per Share (12 months)
Influences and Considerations:
Price-to-Free-Cash-Flow-per-Share (P/FCFPS) Ratio
Formula: Stock Price ÷ Free Cash Flow per Share (12 months)
Influences and Considerations:
Enterprise-Value-to-EBITDA (EV/EBITDA) Ratio
Formula: Enterprise Value ÷ EBITDA (12 months)
Influences and Considerations:
Dividend Yield
Formula: Indicated Annual Dividend ÷ Current Stock Price
Influences and Considerations:
Buyback Yield
Formula: Percentage change in shares outstanding (year over year)
Influences and Considerations:
Shareholder Yield
Formula: Dividend Yield + Buyback Yield
Influences and Considerations:
Understanding how financial statements influence valuation measures allows you to better spot both positive and negative changes.
For instance, when companies grow revenue while maintaining margins, the effects cascade through the valuation ratios. Higher revenue leads to higher earnings (lowering the price-earnings ratio), higher sales per share (lowering the price-to-sales ratio), and potentially higher operating cash flow (lowering the price-to-cash-flow and price-to-free-cash-flow ratios).
Looking at more than one valuation measure can help you determine where to look on the financial statements. Similarly, analyzing the financial statements can give you more insight into whether a stock is attractively valued.
AI-Powered Investing



No comments have been added yet. Add your thoughts to the discussion!
You need to log in as a registered AAII user before commenting.
Log InCreate an account