



Featured Tickers:
- AAII Stock Screens winners and losers
- Why returns are driven by value, growth, momentum, estimate revisions, quality and financial strength
- Common traits of long-term winning strategies
The table here highlights the top- and bottom-performing screening strategies for 2025, along with annualized risk-adjusted winners and losers since 1998.
While the strongest gains for the year came from large-cap growth, mid- and small-cap value styles started showing strength in 2025.
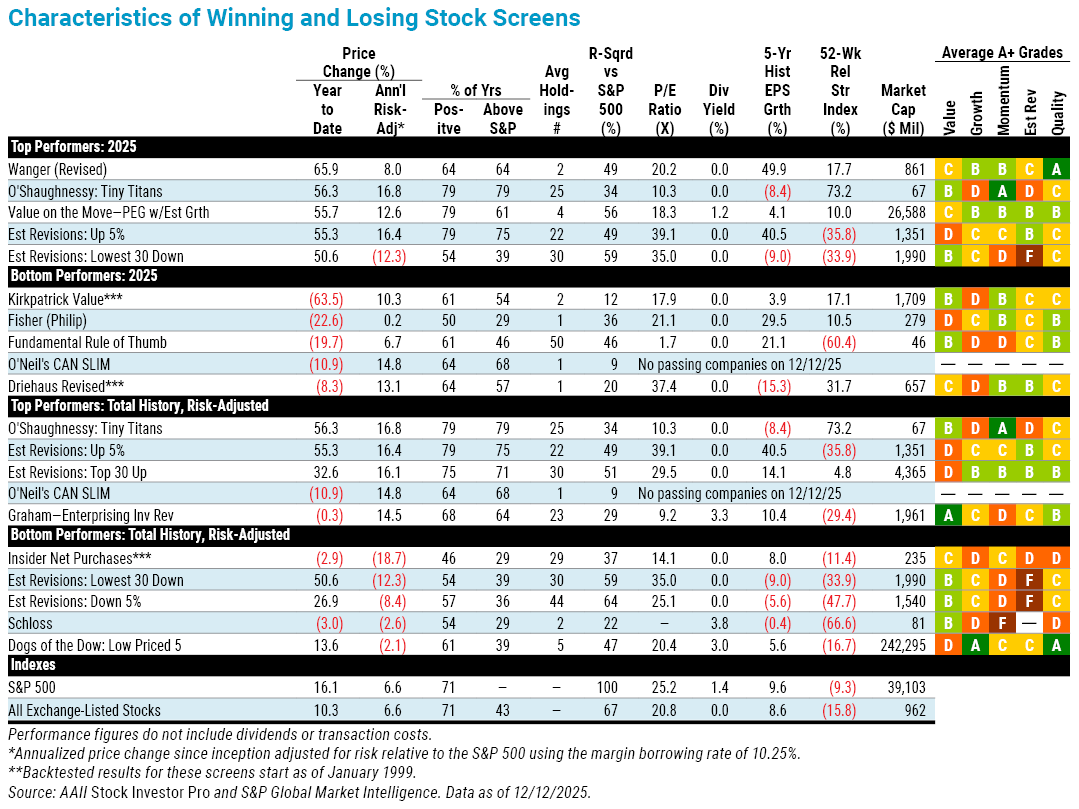
It was surprising that the Estimate Revisions Lowest 30 Down screen cracked the list of top-performing 2025 strategies while also being among the weakest long-term approaches. Strong returns for this normally negative screen have typically occurred in transition years with strong sector rotation and uncertainty, such as 2020 (the coronavirus pandemic), 2009 (the Great Recession) and 2001 (post–dot-com bubble).
The S&P 500 index has achieved positive price gains in 71% of calendar years over the last 28 years. The Insider Net Purchases screen has the weakest record, with only 46% of calendar-year returns positive. Five strategies are tied for the highest percentage of positive years at 86%: Buffett Hagstrom, Buffettology EPS Growth, Buffettology Sustainable Growth, Dreman With Estimate Revisions and Value on the Move PEG With Historical Growth. The O’Shaughnessy Tiny Titans screen has outperformed the S&P 500 most frequently on a calendar-year basis—79% of the last 28 years.
The R-squared statistic in the table indicates how much of a screen’s performance can be explained by the S&P 500’s price movement: An R-squared of 100% means a screen’s monthly price movements fully mirror the S&P 500. Only 34% of the O’Shaughnessy Tiny Titans screen’s monthly price movement is explained by S&P 500 movement.
Market capitalization is a common way to measure company size, and most indexes are weighted by market cap so larger companies have greater impact on index performance. Generally, the top-performing 2025 screens fell into the small- or mid-cap classification and held concentrated portfolios with few passing stocks. Except for the Dogs of the Dow Low Priced 5 screen, the bottom-performing screens also tended to focus on smaller companies. The Insider Net Purchases screen excludes companies with market caps above $1.0 billion. Despite research suggesting that insider buys of smaller companies outperform those of larger firms, this strategy has delivered poor long-term results.
Companion articles to the 2025 Review of AAII Stock Screens
Value
The top-performing screens in 2025 generally emphasized growth at a reasonable price—supporting higher valuations with proven earnings growth. Stocks currently passing the Wanger Revised screen have a median price-earnings (P/E) ratio of 20.2 and an A+ Value Grade of C.
There is a broader mix within the top long-term performers group, from the value-focused Graham Enterprising Investor Revised and O’Shaughnessy Tiny Titans screens to the growth-oriented O’Neil CAN SLIM screen, which lacks value filters. The Estimate Revisions screens completely ignore valuation and other fundamental or price factors, and their current holdings have relatively high price-earnings ratios and low A+ Value Grades.
Growth
The Wanger Revised screen has the highest historical earnings growth rate among the AAII Stock Screens of 49.9% and an average A+ Investor Growth Grade of B. The Growth Grade emphasizes consistency of growth and cash flow generation over high absolute growth levels. Note the difference between the high positive historical earnings growth of stocks in the Estimate Revisions Up 5% screen versus negative growth among stocks in the Estimate Revisions Lowest 30 Down screen.
Historically, screens targeting reasonable or consistent growth perform better than those focused on extremely high growth rates. High-growth stocks often disappoint when investors overpay, and prices decline when expectations aren’t met. Stocks passing the O’Neil CAN SLIM screen must have at least five consecutive years of earnings increases.
Momentum
Momentum measures a stock’s price change relative to others over a specific period. Stocks with high momentum tend to continue outperforming, while those with low momentum typically continue their underperformance. The relative strength index in the table compares stock performance to iShares Core S&P 500 ETF  (IVV). A value of 0.0 indicates performance equal to the S&P 500, while 10.0 means 10% outperformance. The A+ Momentum Grade places greater weight on recent quarterly performance (40%) and evaluates a stock’s price change relative to all other stocks.
The O’Shaughnessy Tiny Titans screen exemplifies momentum, with current holdings outperforming the S&P 500 by 73.2% over the past 52 weeks. This strategy focuses on the 25 micro-cap stocks ($25 million to $250 million market cap) with the highest 52-week relative strength and price-to-sales (P/S) ratios below 1.00.
Among the top screens, momentum is a key component of the O’Neil CAN SLIM, O’Shaughnessy Tiny Titans and Value on the Move PEG With Estimated Growth screens.
Estimate Revisions
Earnings estimate revisions and earnings surprises can significantly impact share prices for up to one year. Long-term performance trends reinforce this: Screens focusing on upward revisions are among the top risk-adjusted performers, while those targeting downward revisions rank among the worst. Filters for estimate revisions and surprises are present in many of the AAII screens.
Quality and Financial Strength
Most successful strategies include financial strength filters, not as selection criteria but more to exclude companies with weak fundamentals. Top screens also tend to seek out companies with favorable profitability compared to industry norms. Overall, quality filters work best when combined with value, growth or momentum requirements. Top screens over the long term tend to have higher A+ Quality Grades than the weakest-performing screens.
Shared Winning Characteristics
Long-term top-performing strategies share key traits:
- Focus on low relative valuation multiples—e.g., price-earnings ratio, price-to-book-value (P/B) ratio;
- Emphasis on consistent growth in earnings, sales or dividends over absolute high levels of growth;
- Use of price momentum;
- Incorporate upward earnings revisions or positive earnings surprises;
- Screen for strong financials; and
- Emphasis on competitive advantage measured by stock comparisons to sector norms.

Related

Discussion
FREE REPORT

Get your free copy of our special
report analyzing the tech stocks
most likely to outperform the
market.
BARRY J from TX posted 9 months ago:
JOHN L from NJ posted 9 months ago:
BARRY J from TX posted 9 months ago:
Michael H from IL posted 6 months ago:
JEAN H from IL posted 5 months ago:
You need to log in as a registered AAII user before commenting.
Log InCreate an account