



- November market rotation put small caps and mid caps in the lead and caused value to beat growth
- No changes to the portfolio for the fourth quarter; one holding put on earnings probation
- A review of selection rules, with size and value cutoffs verified
There are no changes to the Model Shadow Stock Portfolio after conducting the quarterly portfolio review at the beginning of December.
Performance Update
November delivered a clear shift in market leadership, with mid- and small-cap stocks outperforming large-cap stocks after lagging behind for most of 2025. While the S&P 500 index only gained 0.2%, the S&P MidCap 400 index rose 2.0% and the S&P SmallCap 600 index gained 2.7%, signaling a broadening of market participation beyond the mega-cap stocks that have dominated for much of the year.
This improvement was visible in breadth as well, particularly among small caps, where 381 stocks advanced and 217 declined in the S&P SmallCap 600—the strongest internal momentum of the three S&P index size tiers. Vanguard 500 Index fund  (VFINX) advanced 0.2% in November, while the AAII Model Shadow Stock Portfolio gained 1.8%. Among small-cap benchmarks, Vanguard Small Cap Index fund (NAESX) gained 1.4%.
November also brought a distinct rotation into value. Large-cap value rose 1.7%, sharply outperforming large-cap growth, which fell 0.9% under the weight of profit-taking in mega-cap technology companies. Mid- and small-cap growth held up better, but value still led across the style spectrum, helped by improving interest-rate expectations and stronger performance in sectors like financials, energy and consumer staples.
Sector-level performance further underscored the market’s rotation. The health care sector was a strong performer during November as investors gravitated toward defensive earnings strength and more reasonable valuations after a long period of underperformance. Consumer staples, another defensive sector, also posted solid gains. Meanwhile, information technology was the weakest sector, as November marked a period of consolidation after an exceptionally strong year for companies related to artificial intelligence (AI).
Year-to-date returns still show a wide gap between large caps and the rest of the market. The S&P 500 is up 17.8% through November, driven primarily by mega-cap technology and communication services stocks. Meanwhile, returns for the S&P MidCap 400 and S&P SmallCap 600 are more modest—up 7.4% and 6.1%, respectively. The Model Shadow Stock Portfolio is up 15.4% year to date. Figure 1 shows performance over longer time periods.
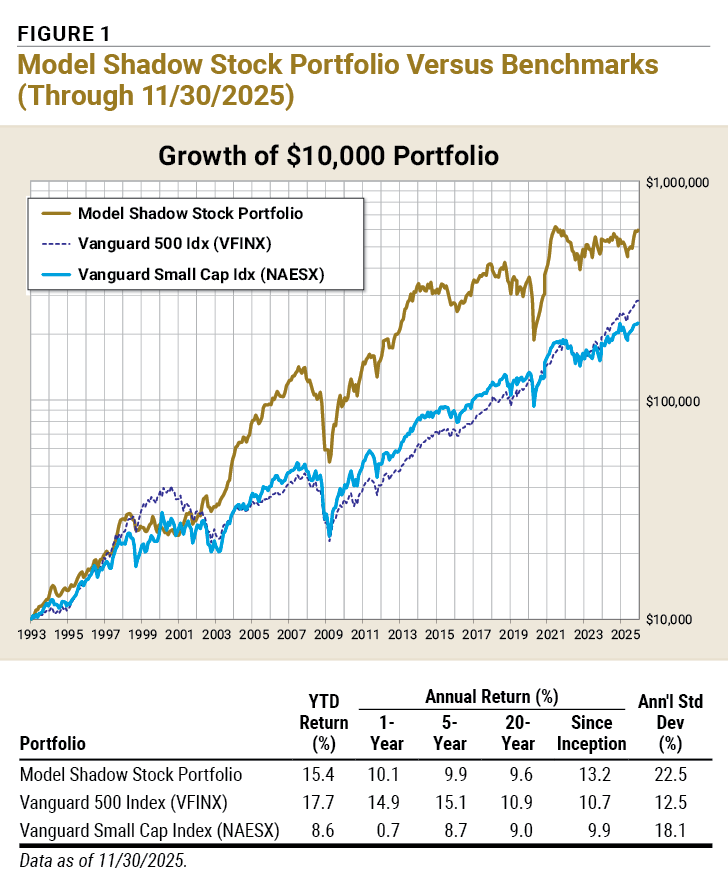
November provided an early glimpse of market broadening—value outperforming growth, smaller companies showing relative strength and defensive sectors regaining momentum. If expectations for lower interest rates continue into 2026, this rotation may represent the first stage of a more durable shift in market leadership.
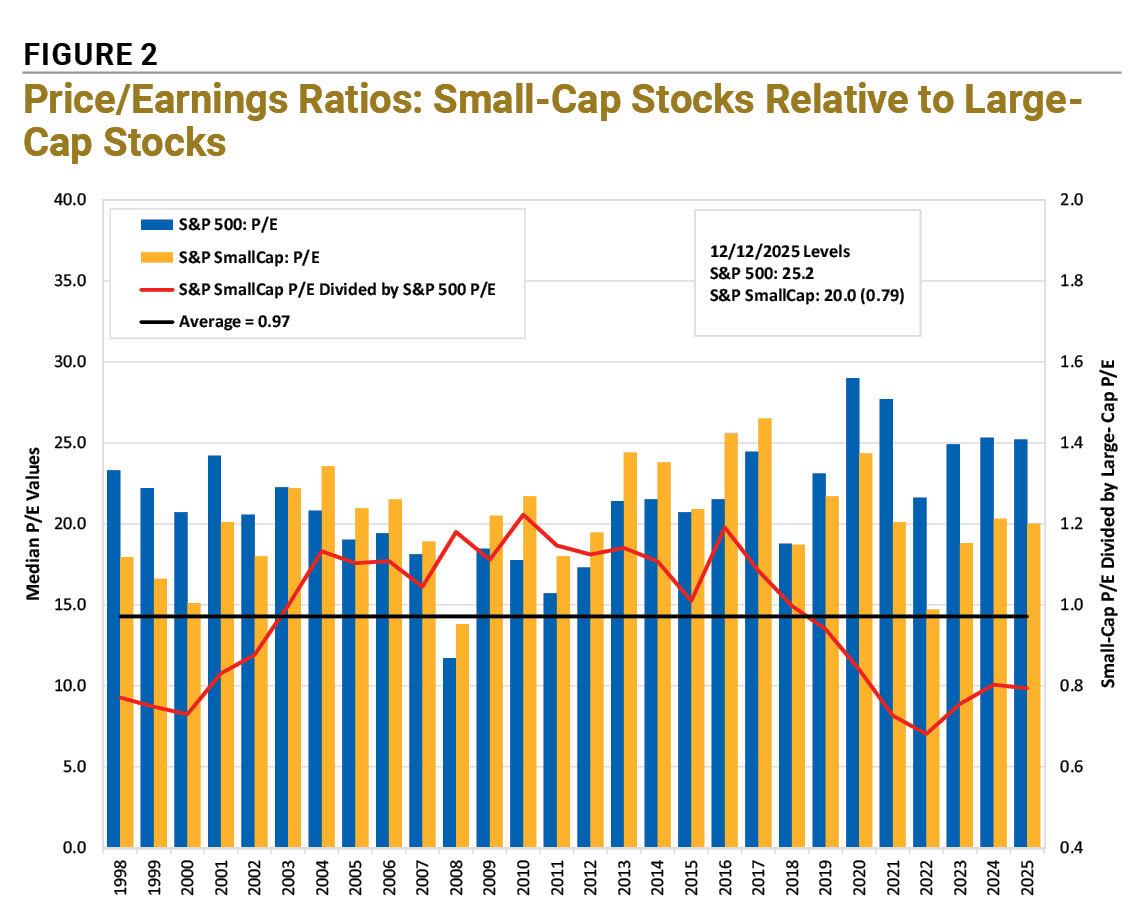
Small-cap stocks remained attractively priced relative to large-cap stocks. The median price-to-book-value (P/B) ratio of the companies in the S&P SmallCap 600 was 1.71, well below the 3.54 median ratio for the companies in the S&P 500. The S&P SmallCap 600 normally trades at a discounted multiple relative to the S&P 500. The discount has averaged 0.65 since 1998 and was 0.48 as of December 12, 2025.
As shown in Figure 2, the median price-earnings (P/E) ratio is 25.2 for the stocks in the S&P 500, compared to 20.0 for stocks in the S&P SmallCap 600. Stocks normally trade with higher price-earnings ratios if investors anticipate higher future earnings growth as well as greater certainty (lower risk) of achieving growth. Smaller-company stocks normally trade at a discount to larger firms because of their greater risk and lower liquidity, but they currently continue to be more attractively priced than their historical norms.
Quarterly Portfolio Review
The Model Shadow Stock Portfolio was designed to test the strategy of investing in the 1% intersection of the smallest and cheapest publicly traded stocks. Research conducted by Eugene Fama and Kenneth French (Journal of Finance, June 1992) showed that, on average, the smaller the market capitalization of a company, the higher its future stock returns. In addition, the lower the ratio of market price to book value, the higher the returns. The highest returns came from those stocks that were in the lowest market-cap decile and the lowest price-to-book decile.
The primary Model Shadow Stock Portfolio selection criteria target the intersection of the smallest 10% of domestic stocks as measured by market cap, along with the “cheapest” 10% of domestic stocks as measured by the price-to-book ratio (10% x 10% = 1% intersection). These decile breakpoints are determined by examining domestic companies that are listed on the New York Stock Exchange (NYSE) and then applying the size and value breakpoints for stocks listed on all domestic exchanges. The intersection of 10% constitutes the primary initial selection universe.
Table 1 shows the stocks that currently make up the Model Shadow Stock Portfolio. The model portfolio is reviewed quarterly to determine portfolio deletions and additions. The quarterly review cycle is tied to the reporting cycle of most firms and limits costly portfolio turnover. AAII’s stock analysis and screening service Stock Investor Pro, with data as of December 12, 2025, was used for the fourth-quarter review. After conducting the review, there were no additions or deletions.
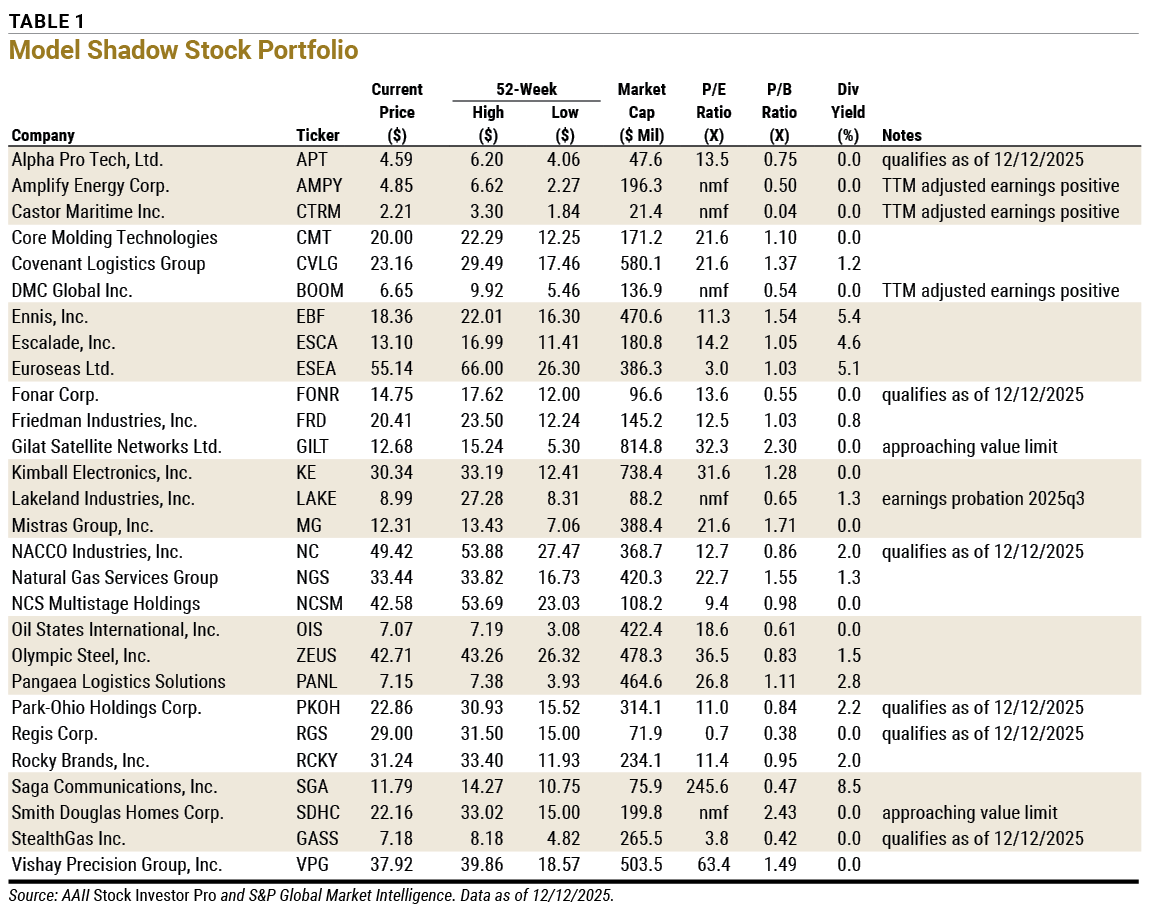
Approaching Size Limit: Stocks are sold if their market capitalization goes above three times the initial maximum criterion and there is a stock to replace it. The current market-cap maximum for initial screening is $400 million. Stocks are marked “approaching size limit” if their current market cap exceeds 2½ times the initial criterion, or $1.0 billion.
Approaching Value Limit: Stocks are sold once their price-to-book-value (P/B) ratio goes above three times the initial criterion and there is a stock to replace it. The current initial price-to-book ceiling is 0.90. Stocks are marked “approaching value limit” if their current price-to-book ratio exceeds 2½ times the initial criterion, or 2.25.
Earnings Probation: If the last 12 months’ earnings are negative, the stock is put on probation; if a subsequent quarter has negative earnings prior to 12-month earnings becoming positive, the stock is sold. When available, adjusted (non-GAAP) earnings are used to put stocks on probation or remove them. Otherwise, earnings from continuing operations are used. The date is the calendar quarter for which the company first reported negative trailing 12-month earnings.
Qualifies As Of: Stock still qualified as an addition when the screen was run with current data. Stocks that don’t currently qualify as an addition are held until they meet one of the deletion rules.
TTM Adjusted Earnings Positive: Trailing four-quarter GAAP earnings are negative, resulting in no meaningful figure for the price-earnings (P/E) ratio. However, adjusted earnings for the period are positive.
Value
The price-to-book cutoff has increased slightly from 0.92 at the beginning of September to 0.93. The current initial qualifying maximum price-to-book ratio is 0.90, and we left it unchanged. Qualifying stocks must have a price-to-book ratio of 0.90 or lower when added to the model portfolio. There were 925 exchange-listed securities with a price-to-book ratio less than or equal to 0.90 on December 12, 2025, up from 894 at the end of September. Stocks in the model portfolio are removed for valuation if they exceed three times the initial maximum price-to-book ratio at the time of a quarterly portfolio review—2.70.
Smith Douglas Homes Corp. (SDHC) has the highest price-to-book ratio in the model portfolio at 2.43. No stocks in the model portfolio exceeded the maximum price-to-book ratio at the time of review.
Size
We examined the market-cap levels of domestic companies listed on the NYSE to determine the size cutoff for the lowest decile when adding stocks to the model portfolio. The lowest decile market-cap level increased from $362 million in September to $400 million using data in Stock Investor Pro as of December 10, 2025. We maintained the maximum initial qualifying market-cap value at $400 million. There were 1,382 exchange-listed securities with a market cap between $30 million and $400 million. Holdings are removed if their market cap goes above three times the initial criterion at the time of the quarterly review.
Gilat Satellite Networks Ltd. (GILT) had the highest market cap in the portfolio at $814.8 million, but this did not exceed the $1.2 billion market-cap maximum at the time of review.
Earnings
If a company has trailing 12-month earnings from continuing operations that are negative, the stock is placed on probation; if a subsequent quarter has negative earnings prior to trailing 12-month earnings becoming positive, the stock is deleted. When available, normalized (non-GAAP) earnings are used to put stocks on probation or remove them.
There were no companies on earnings probation at the start of third-quarter 2025 earnings season. However, Lakeland Industries Inc. (LAKE) reported negative quarterly results during December, placing it on earnings probation once again.
Qualifying Companies
As of December 12, 19 stocks met the initial selection criteria for the Model Shadow Stock Portfolio, down from 25 in November. AAII members can see and research which companies are currently passing the initial selection criteria in the Shadow Stock Ideas table on AAII.com. The list of new Shadow Stock Ideas is updated daily—Tuesday through Saturday.
Qualifying companies are those held in the Model Shadow Stock Portfolio that currently meet the initial portfolio addition rules. (They are designated as “currently qualifies” in the Notes column of the Model Shadow Stock Portfolio table on AAII.com and noted in Table 1.)
Of the 19 companies passing the initial selection criteria, six are currently held in the Model Shadow Stock Portfolio, down from 10 in November. The market caps of Oil States International Inc. (OIS) and Olympic Steel Inc. (ZEUS) moved above $400 million. Additionally, NCS Multistage Holdings Inc.’s (NCSM) price-to-book ratio rose above 0.90, and Saga Communications Inc. (SGA) reported a quarterly earnings loss, removing it from the list of currently qualifying stocks.
Next Portfolio Review
The next quarterly review of the Model Shadow Stock Portfolio will take place following the release of fourth-quarter 2025 earnings results in March.
If there are any changes to the model portfolio, they will be announced at that time in the Model Shadow Stock Portfolio Update email. Sign up for this email so you don’t miss it.
Discussion
FREE REPORT

BARRY J from TX posted 9 months ago:
JOHN N from MI posted 9 months ago:
You need to log in as a registered AAII user before commenting.
Log InCreate an account