

Related

First Cut Stocks
A market technician, Kirkpatrick developed mechanical processes for finding outperforming stocks and overcoming emotional decision-making.
by Matt Markowski | May 2023

Charles Kirkpatrick is the former president of Kirkpatrick & Co., a technical research firm. In his book, “Beat the Market: Invest by Knowing What Stocks to Buy and What Stocks to Sell” (FT Press, 2008), Kirkpatrick developed mechanical processes for finding outperforming stocks and overcoming emotional investment decision-making. His strategies rely on a “relative” investment philosophy instead of using absolute criteria such as requiring a certain earnings growth rate below which companies will not be considered.
In this article, we revisit Kirkpatrick’s research and the performance of AAII screens based on his strategies.
Percentile Rank: The ranking of a specific metric for a stock relative to all other companies. Stocks ranking in the highest percentile have the highest values for a selected metric.
Price-to-Sales Ratio: A stock’s current share price divided by net sales over the last four quarters. This ratio is used to identify undervalued stocks that are less risky during a market downturn.
Relative Earnings Growth: The growth of a company’s last four quarters of earnings versus that of the prior four quarters. This growth rate is then compared to all exchange-listed stocks to determine the percentile rank.
Relative Price Strength: A stock’s price performance relative to that of a benchmark, such as a major market index. Kirkpatrick uses a stock’s weekly closing price relative to its historical moving average of prices.
Stop Order: An instruction to the broker to sell a stock if it falls below a specified price.
Technical Analysis: A type of stock analysis using market price data and volume data, typically displayed graphically in charts. The charts are analyzed using technical indicators. Basic concepts are applied to charts, including relative strength analysis, trend, consolidation and support and resistance. Identifying the trend is a large part of technical analysis, as is identifying chart patterns.
Kirkpatrick used his knowledge from over 40 years of investment research to build his stock strategies. In his words, the market’s behavior can be split into three parts: facts, anticipation and emotion. The facts are financial data that companies report and news that causes their stock prices to change. The anticipation of future performance causes analysts covering stocks to create a highly competitive environment. Finally, Kirkpatrick notes that emotions cause investors to make irrational decisions. As he put it, the stock market is “the sum of all information known and anticipated, interpretation of that information, and emotional reactions to that information, right or wrong.”
Kirkpatrick’s analysis identified several behavioral problems that he and many investors face. First, he recognized his impatience every time he bought or sold a stock, only wanting to buy at the absolute low and sell at a high. This prompted him to look for strategies to identify when these periods occur. Second, he reluctantly admitted that nobody likes to be wrong. The worst feeling is making a stock pick that turns out to be a huge loser, and it takes discipline to overcome those losses and sell before it gets worse. Finally, he recognized the importance of having the discipline to follow a well-defined strategy and make decisions using specified rules.
In order to avoid emotional biases, Kirkpatrick believes individual investors must create a mechanical process that reduces emotion and eliminates any attempts to predict the future. He spent a great deal of time testing specific investing methods to try to solve the behavioral problems he identified. Based on these tests, he chose the methods that showed a history of performing well. Kirkpatrick’s methods are all based on a strategy of “reaction,” which involves waiting for the market to indicate what it is going to do and then (re)acting accordingly.
To react, he uses buy and sell “triggers.” Kirkpatrick’s buy and sell triggers are based on relative rankings for the key investment characteristics his analyses showed to have been successful in the past. These characteristics include valuation (price to sales), growth (reported earnings growth) and momentum (price strength).
In his book, Kirkpatrick presents three different investment models—a growth model, a value model and a bargain model—that all play on the same buy-and-sell trigger theme.
One of the main tools used in technical analysis of stocks is relative strength, which is the price performance of a stock divided by the price performance of a benchmark, such as a major market index or the returns of all other stocks. Outperforming stocks have higher levels of relative strength while underperforming stocks have lower levels of relative strength.
Note that a stock could have a weak level of relative strength even though it has risen in price since purchase. This occurs if the benchmark used to determine relative strength went up by a greater percentage than the stock. Conversely, if the stock’s price decreased but the benchmark declined by an even greater amount, then the relative strength for the stock would be strong. Kirkpatrick found that relative price strength is the most reliable short-term stock selection technique.
Kirkpatrick was concerned about capital loss, so his relative strength calculation involved dividing a stock’s current weekly closing price by the 26-week moving average of its closing prices. He added up the week-ending closing prices for each of the last 26 weeks and divided this total by 26. For each subsequent week, the oldest price was dropped, and the latest weekly close was added to calculate the moving average. He then ranked all the stocks so those with the highest relative strength were in the highest percentile rank.
Kirkpatrick analyzed the price performance of these relative strength percentile rankings and found that there was a strong correlation between relative price strength and forward price performance. Also, by using price strength relative to a stock’s own historical prices, you can better avoid large capital losses. Each of the three strategies he developed utilize the 26-week relative price strength as both buy and sell criteria.
To capture the essence of Kirkpatrick’s measure, the AAII stock screens use the ratio of the current stock price to the average of the last six monthly closing prices. The numerator in this ratio fluctuates with the weekly closing price but the denominator only changes with the end of each month.
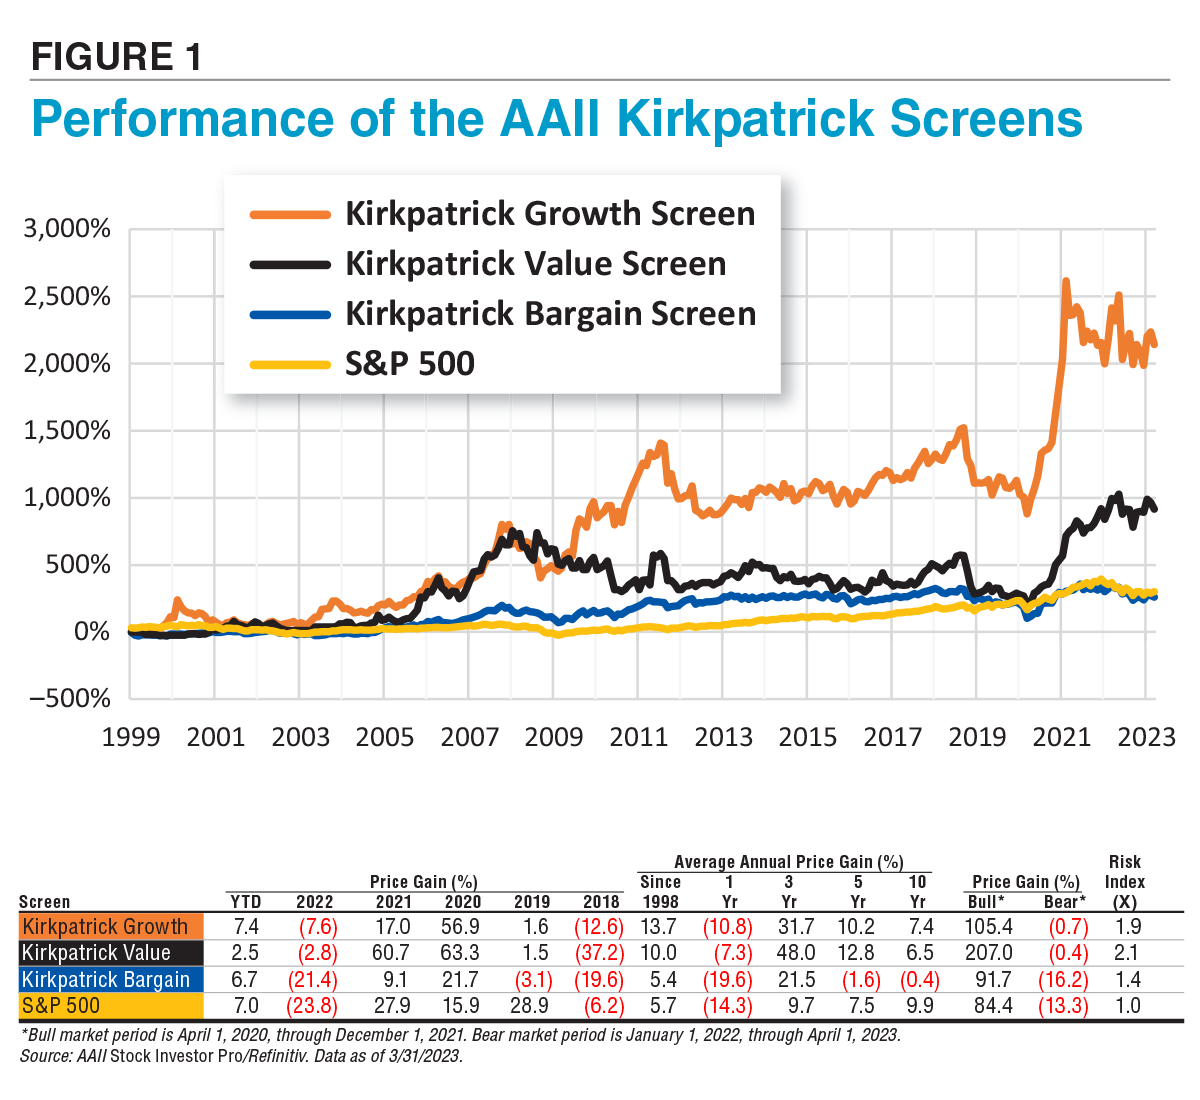
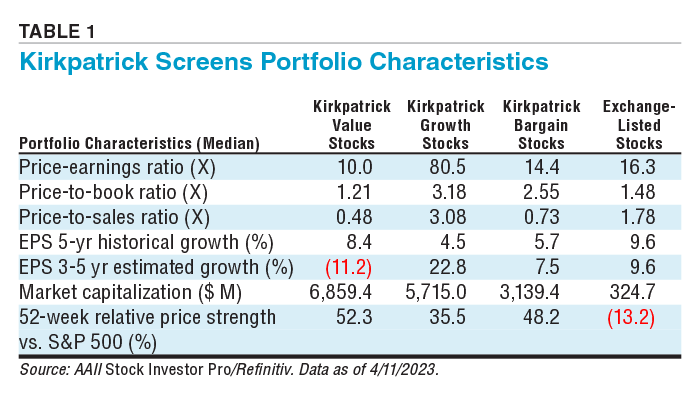
Figure 1 shows the historical performance of the three AAII Kirkpatrick screens compared to the S&P 500. Table 1 provides a sense of the type of companies that pass each of the screens by giving median values for their portfolio characteristics compared to all stocks. Table 2 presents the stocks passing the screens as of April 11, 2023, along with pertinent ratios and percentile rankings.
Kirkpatrick preferred to use historical earnings rather than estimated earnings. Many growth strategies use forward-looking data because stock prices reflect expectations for future cash flows, which rely on profitability. Kirkpatrick questioned the validity of analysts’ estimates and the accuracy of their values.
His preferred growth metric of choice is the reported earnings relative. Specifically, the percentage rank of the last four quarters’ earnings relative to earnings for the prior four quarters. Using full-year earnings helps to avoid seasonality for cyclical companies. Only the companies ranking in the top 10% are eligible for the growth strategy.
Examining the three-, six- and 12-month price performance of the earnings growth percentiles, he found the expected positive correlation between earnings growth and subsequent relative price performance. But the relationship was not as strong as it was for the relative price-to-sales ratio. This finding indicated to him that reported earnings growth may not be as useful a selection criterion when testing over many market periods.
Furthermore, he found that over time performance turns below average for the percentile with the very highest reported earnings growth. Thus, be cautious of companies ranking in the highest percentiles. Such growth rates are difficult to maintain.
To mitigate losses in this strategy, Kirkpatrick used technical indicators to avoid large fluctuations in stock prices. Specifically, he set stop orders to limit losses on the growth stocks the strategy followed. A sell stop order instructs a broker to sell a security if its price falls below a preset price. This limits losses by setting a price below which the stock will no longer be held. Kirkpatrick’s method was to use chart patterns to set these stop orders. He looked at the previous price for which a stock corrected (or dropped) and then reversed upward. At that price, there were buyers that existed to send the stock price upward. However, if its price fell below that level, there are likely no longer as many buyers interested in that stock and its price could drop even further as result.
While the AAII model of the growth strategy does not use sell stop orders, the AAII Kirkpatrick Growth screen has realized the best performance out of the three Kirkpatrick screens, with an annualized return of 13.7% since 1998. The AAII Kirkpatrick Growth screen also outperformed the S&P 500 in 2022, down 7.6% compared to a 23.8% loss for the index. As of March 31, 2023, the strategy is up 7.4% for this year.
The value strategy was born out of concern that the growth strategy would underperform during down periods in the market. The growth strategy was created during a bull market in the 1990s. For growth, there is no consideration for losses and risk other than setting stop orders. Kirkpatrick felt he needed a strategy to find stocks with below-average risk to begin with. Thus, the value strategy adopted the price-to-sales ratio to avoid overpriced stocks that were highly susceptible to underperformance during down periods in the market.
Kirkpatrick read the book “What Works on Wall Street” by value investor James O’Shaughnessy and found that the price-to-sales ratio revealed stocks with less capital risk. Following similar steps as in the growth strategy, Kirkpatrick used relative price-to-sales ratios for assessing which stocks were valued inexpensively and which were not. He replaced the stop orders with a price-to-sales ratio range and found that the performance of the value strategy was much better than the growth strategy from 1998–2008. There was an inverse relationship between a stock’s relative price-to-sales ratio percentile and its relative price performance over the next three to six months. In other words, as the price-to-sales percentile increased, future returns decreased. For periods of 12 months, this relationship dissipated. This suggested to Kirkpatrick that investors should not focus on periods longer than one year. From his research, stocks with price-to-sales ratios ranking in the bottom 30% performed the best over the period.
The AAII Kirkpatrick Value screen is the second-best performer out of the three, with an annualized return since 1998 of 10.0%. The AAII Kirkpatrick Value screen outperformed the other two screens in 2022, losing only 2.8% for the year. Additionally, the screen performed exceptionally well in 2021, increasing by 60.7%. As of March 31, 2023, the strategy is up 2.5% for this year.
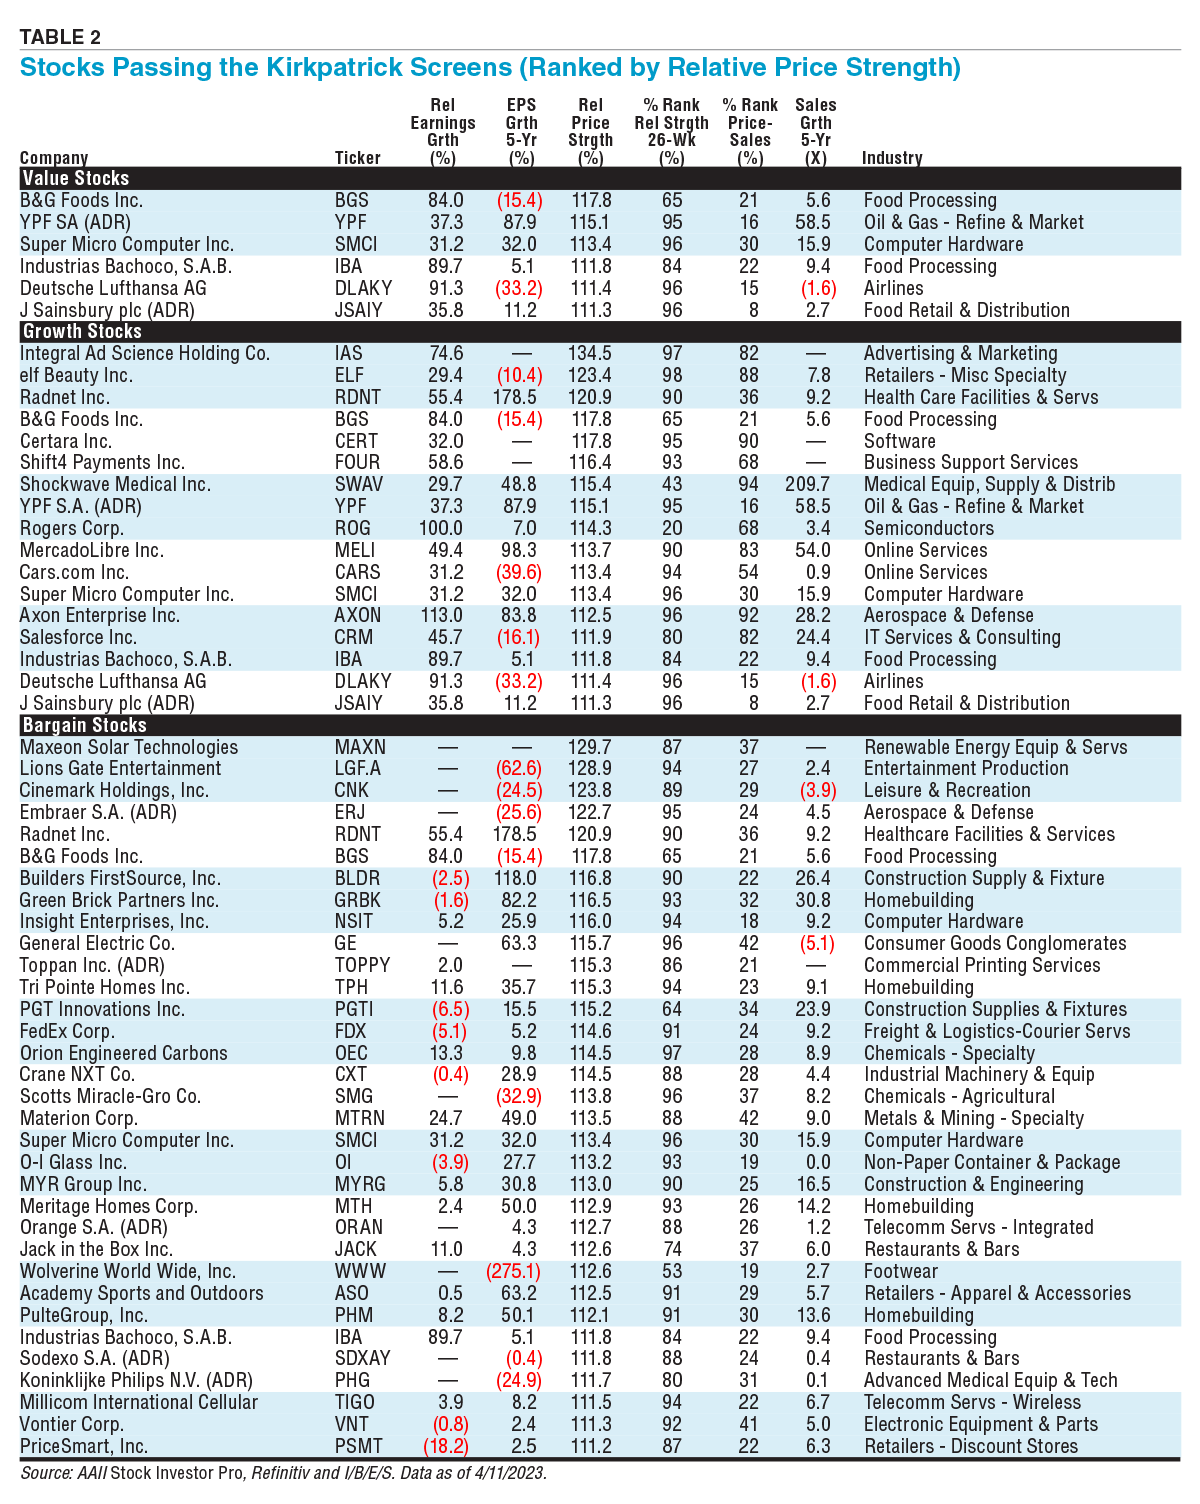
Go to AAII Guru Screens for an updated list of stocks passing this screen.
After years of studying the growth and value strategies, Kirkpatrick developed a strategy aimed at using the best triggers to buy and sell stocks. His bargain strategy utilizes criteria similar to the other two strategies but is optimized based on the best performers over the short period he identified. From January 2006 to March 2008, Kirkpatrick found that stocks with price-to-sales percentile ranks greater than 17 but not higher than 42 showed the best performance. Therefore, for the AAII Kirkpatrick Bargain screen, companies are required to have a price-to-sales percentile rank greater than or equal to the lowest 17% of stocks and less than or equal to the highest 42%. Kirkpatrick’s analysis of earnings growth and future price performance for this strategy indicated only a weak correlation between the two. As a result, he decided to omit relative earnings growth as a selection criterion for his bargain model.
For both the growth and value models, Kirkpatrick selected stocks with relative price strength in the 90th percentile or higher. When he started the bargain model, Kirkpatrick upped the requirement to include only companies in the 97th percentile or higher to reduce the number of passing companies. However, when the Kirkpatrick Bargain screen was backtested, restricting the relative price strength to the best 3% of all stocks led to a very small number of passing companies. So, the relative price strength was relaxed to include companies whose relative strength ranked in the 90th percentile or higher unless more than 20 companies passed. In such cases, the highest percentile rank is used to determine which companies pass the screen. As of April 11, 2023, isolating the top 3% of the 7,117 companies in AAII’s Stock Investor Pro database with valid (non-null) values for the relative price strength rank resulted in 220 passing companies. However, adding this filter to the rest of the criteria Kirkpatrick uses for the bargain model results in only two passing companies.
Kirkpatrick only tested the performance of the bargain strategy for a little over two years, so he recommended that more testing be done on the efficacy of the strategy. The Kirkpatrick Bargain screen is the weakest of the three screens in terms of historical performance. The screen has been more volatile than the S&P 500, with both higher maximum monthly returns and larger monthly drawdowns. The bargain screen slightly outperformed the S&P 500 in 2022, losing 21.4% for the year. As of March 31, 2023, the strategy has the second-best year-to-date performance of the three, up 6.7%.
Charles Kirkpatrick believes a mechanical approach to investing will help investors avoid their own biases that ultimately cost them money. His buy and sell triggers are based on relative data elements—price to sales, reported earnings growth and price strength. His analysis has led him to three investment models—growth, value and bargain.
For all three models, Kirkpatrick requires a minimum share price of $10. For the value model, he requires a minimum market capitalization of $500 million; he uses a $1 billion minimum market cap for the growth and bargain models.
Growth Model
Value Model
Bargain Model
For the growth model, Kirkpatrick uses point and figure charts to help in the buy and sell process. He only buys stocks for the growth model when they are in an upward trend, as indicated by two higher highs in a three-point reversal point and figure chart.
Growth Model
Value Model
Bargain Model
First Cut Stocks
AAII Stock Ideas


BARRY J from TX posted over 3 years ago:
Kenneth P from NY posted over 3 years ago:
You need to log in as a registered AAII user before commenting.
Log InCreate an account