



Return on equity (ROE) is a popular measure of profitability and corporate management excellence. The simplest method of calculation is to divide earnings for the last four quarters (trailing 12 months) by shareholder’s equity. This relates earnings generated by a company to the investment that shareholders have made and retained within the firm. Shareholder’s equity is equal to the total assets of the firm less its total liabilities and represents investors’ ownership interest in the company. On the balance sheet, it is the sum of preferred stock, common stock and retained earnings.
The return on equity ratio is a simple but powerful method for determining company success. Ideally, as a shareholder, the earnings of the firm are “returned” either through reinvestment into the business or paid out via dividends. Generally, a return on equity of 15% is considered good, and 20% or higher is considered exceptional. Calculation of return on equity is simple but can be broken down into three parts: net profit margin, total asset turnover and financial leverage (Figure 1). This is referred to as the DuPont analysis.

The DuPont analysis was developed by Donaldson Brown, an executive at DuPont, in the early 20th century. Its purpose was to break down return on equity into three supporting metrics.
Net profit margin, calculated as net income divided by sales, shows how well a firm is converting sales into income. A higher net profit indicates that the company has operational efficiency, which is reflected in its ability to manage expenses from operating, financing and taxes.
Asset turnover, calculated as sales divided by total assets, shows how well a company uses its asset base to produce sales. Poorly deployed or redundant assets result in a low asset turnover that adversely reflects return on equity and profitability.
Multiplying these two metrics together results in return on assets (ROA), or net income divided by total assets. This is essentially a return on equity that has not yet been adjusted for financial leverage. In fact, for a company with no liabilities, return on assets and return on equity are equal. A firm can increase its return on assets—and thereby its return on equity—by increasing its profit margin or its operating efficiency as measured by return on assets. Margins are improved by lowering expenses relative to sales. Asset turnover can be improved by selling more goods with a given level of assets. This is why companies divest assets (operations) that do not generate a high degree of sales relative to the value of the assets or assets with declining sales generation.
The third metric, financial leverage, shows us how heavily a company is financed by debt. Calculated as total assets divided by shareholder’s equity, the greater the value of this leverage ratio, the greater the financial risk of the firm and the greater the return on equity. When companies have more debt, shareholder’s equity decreases, thus increasing their leverage ratio. This ratio is sometimes referred to as the equity multiplier since companies can use debt to acquire profitable assets and thereby boost income (the numerator in the return on equity equation).
Definitions of Terms
Return on Equity: A profitability measure calculated by dividing net income by average shareholder’s equity. Return on equity is the level of income attributed to shareholders against the investment that shareholders put into the firm.
Shareholder’s Equity: The investor’s ownership interest in the company, calculated by subtracting total liabilities from total assets. Also called stockholder’s equity.
DuPont Analysis: A framework for analyzing a company’s return on equity in terms of its profitability, efficiency and leverage. Uses the product of three ratios: net profit margin, asset turnover and financial leverage.
Net Profit Margin: The percentage of revenues that realized income represents after all business expenses—cost of goods sold plus operational, administrative, financing and tax expenses—are accounted for. The calculation is net income divided by sales.
Asset Turnover: A ratio that measures how efficiently a company uses its total assets to generate revenues. The calculation is net revenues divided by average total assets.
Financial Leverage: A ratio that measures to what degree a company is financed through debt as opposed to equity. The greater leverage, the greater the financial risk of the company. The calculation is total assets divided by shareholder’s equity.
An Example of How ROE Varies by Industry
The breakdown of return on equity into the three ratios helps view the overall financial position of a company. Specifically, companies that are profitable, efficient and use debt effectively are positioned to grow and better succeed. However, there are pitfalls when using return on equity to compare companies from different industries. Return on equity is largely determined by the overall capital structure of a firm.
Since different industries have varying levels of debt and asset turnover, comparing return on equity ratios across industries tells you more about the industries than if one company is better run than the other.
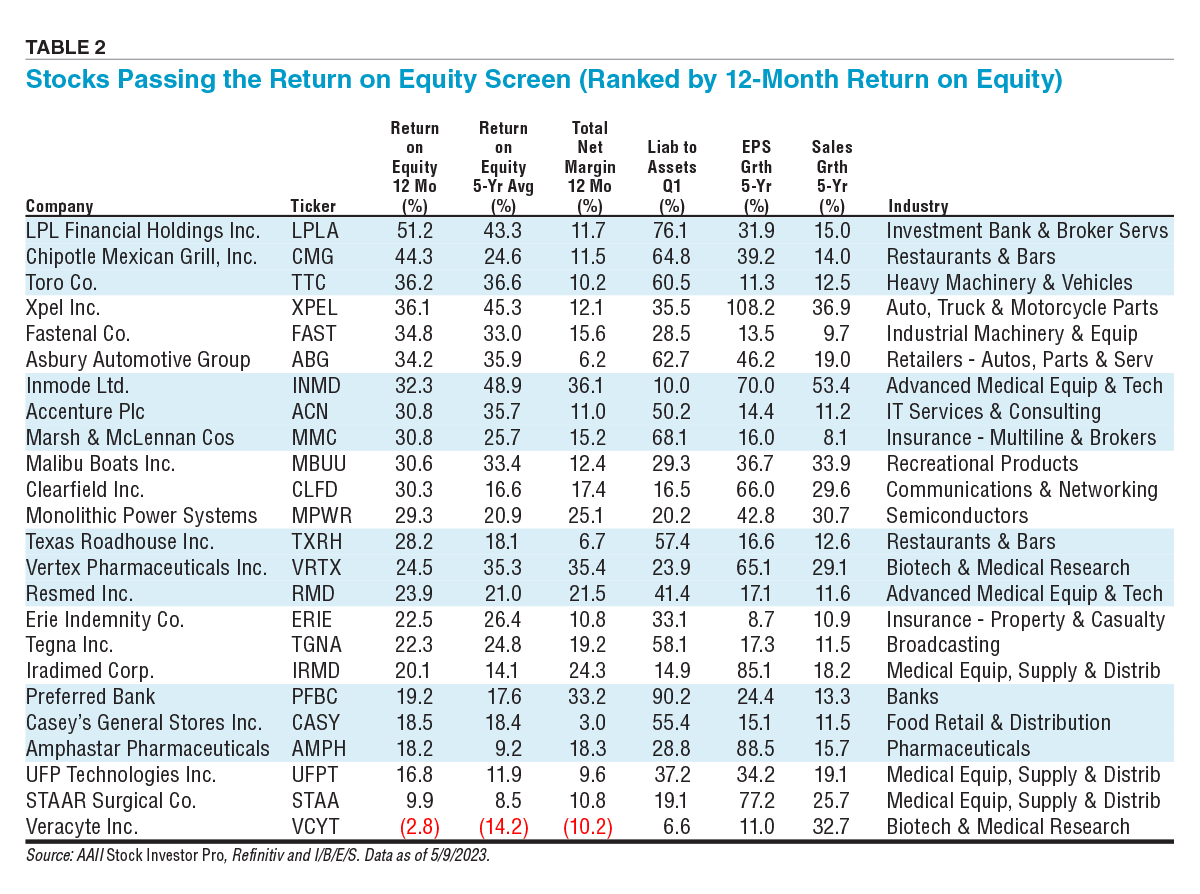
As an example, Asbury Automotive Group Inc.  (ABG) operates automotive dealerships across the U.S., while Accenture Plc (ACN) provides consulting and information technology (IT) services. Asbury Automotive has a return on equity of 34.2% versus Accenture’s return on equity of 30.8%. Without looking at anything else, you could argue that since Asbury Automotive has a higher return on equity, it is a better-managed company. However, Asbury Automotive reported more than $1 billion in inventory on its most recent balance sheet, while Accenture carried no inventory.
The impact of this difference can be seen by examining financial risk. Asbury Automotive has a total-liabilities-to-total-assets ratio of 62.7%, compared to 50.2% for Accenture. Accenture is less capital-intensive (meaning it requires fewer assets proportionate to its revenues) while Asbury Automotive must maintain a constant inventory of vehicles and parts. The higher leverage allows Asbury Automotive to realize a higher return on equity by financing inventory, but with the trade-off of higher risk.
Notably, Accenture has a much lower asset turnover ratio at 1.3 compared to Asbury Automotive’s 1.9. This reflects the differing nature of the two businesses—specifically the inventory that Asbury Automotive carries.
Accenture has the higher net profit margin at 11.0% versus 6.2% for Asbury Automotive. Accenture provides services whereas Asbury Automotive sells physical products.
All this analysis stresses the importance of breaking down return on equity into its component metrics as well as understanding how business models may affect those numbers. An absolute value of return on equity tells you very little about the drivers of a company’s profitability. Depending on what a company does, it may or may not make sense to take on more debt to boost return on equity, given the associated risks.
Taking on more debt increases the overall risk for a business because it must be able to service the debt and not run afoul of debt covenants. Say Asbury Automotive increases the number of vehicles it has for sale, either from the manufacturers it works with, from sourcing more used vehicles and/or acquiring additional dealerships. It can boost revenues by selling those additional vehicles, thereby realizing proceeds to service the debt. Should vehicle sales drop, Asbury Automotive would be left with excess inventory and lower profits to service its debt. Regardless of what sales are, the debt must be repaid.
The key point is that while taking on more debt can increase overall net income and thereby return on equity, it can also backfire. Companies that can effectively use debt will increase their short-term return on equity without harming long-term profitability or growth opportunities.
Return on Equity Screen Performance
AAII tracks a factor screen that looks for companies with consistently high return on equity. Figure 2 provides a summary of the screen’s performance. As of April 28, 2023, the AAII Return on Equity screen was up 8.5% so far this year, slightly underperforming the S&P 500 index’s gain of 8.7%. For 2022, the strategy significantly outperformed the S&P 500 with a decline of 8.8% versus a drop of 23.8% for the index.


It is important to look at long-term and short-term performance for all stock strategies. The average annual price gain for the Return on Equity strategy over five-year and 10-year periods is 13.4% and 9.8%, respectively. Since its inception in 1998, the screen’s annualized return is 11.4% and the cumulative return is 1,428.5%.
Profile of Companies Passing the Return on Equity Screen
The Return on Equity screen has historically been somewhat restrictive, with an average of 13 passing companies per month since its inception. The average monthly turnover rate, meaning proportionately how many companies are added to or dropped from the list of passing companies, is 16.4%. As of May 9, 2023, the screen produced 24 passing companies.
The characteristics of the stocks passing the Return on Equity screen compared to all exchange-listed stocks as of May 9, 2023, are presented in Table 1.

Since the Return on Equity screen is growth-oriented, with no value components, it is not surprising that the passing companies have a higher median price-earnings (P/E) multiple of 24.3 than the typical exchange-listed stock at 16.1. In addition, the median price-to-book-value (P/B) ratio of the passing stocks is 6.87, more than four times the median value for exchange-listed stocks of 1.46.
The strategy’s growth focus is reflected in filters that require historical growth rates for earnings and sales to be positive and also to exceed industry norms. As a result, the median five-year earnings growth rate for companies currently passing the Return on Equity screen is 30.3%, compared to 9.6% for all exchange-listed stocks. In addition, analyst expectations of growth for these companies exceed those for all exchange-listed stocks. The median estimated earnings growth rate for the companies passing the Return on Equity screen is 10.3%, versus 9.5% for all exchange-listed stocks.
The 24 stocks passing the Return on Equity screen as of May 9, 2023, are shown in Table 2. For a current list of passing companies, go to www.aaii.com/stockideas/factors.
Return on Equity Screen Criteria
In creating AAII’s Return on Equity screen, the primary goal was to locate companies with consistently high return on equity. There are also secondary screens to weed out firms with high levels of debt, low margins and low asset turnover. As previously discussed, return on equity and its supporting ratios vary widely across different industries, so it is best to compare company figures to their industry medians.
The first screening criterion seeks out companies with a return on equity that is 1.5 times better than their respective industry medians over the last 12 months and in each of the last five fiscal years. This identifies companies whose management has consistently used shareholder capital to achieve greater profitability. We could have simply screened for companies with return on equity levels of 20% or higher; this would have made the screen far more restrictive and punished companies operating in more capital-intensive industries.
Return on equity is influenced by profitability, efficiency and leverage; therefore, the next set of criteria seek companies that are outperforming their peers in these areas. The screen requires that a firm’s 12-month net profit margin (net income divided by sales) exceeds the industry median. Net profit margin looks at bottom-line profitability.
Twelve-month asset turnover for a firm must also exceed the industry median. Firms exceeding their peers are generating higher levels of sales dollars for a given level of assets.
In terms of financial leverage, companies must have a lower ratio of total liabilities to total assets than their industry median for the most recent quarter. As previously stated, financial leverage increases return but also increases risk since highly leveraged firms have more volatile earnings. Acceptable levels of debt vary from industry to industry.
To help ensure a basic level of growth, earnings and sales growth over the last four quarters must be positive and exceed industry medians. In addition, the five-year historical earnings and sales growth must be positive and exceed the medians for their respective industries.
Lastly, criteria are included for both trading liquidity and special companies. Firms must be listed on an exchange, meaning stocks trading over the counter (OTC) are omitted. Real estate investment trusts (REITs) and American depositary receipts (ADRs) are also excluded due to differences in their financial statements.
Conclusion
Screening for return on equity is a powerful tool for discovering companies that are profitable, efficient and use their balance sheet effectively. Return on equity takes into account three components of business performance: how profitable a company is, how effective it is in turning assets into revenue and how well it uses debt. Since some industries are more capital-intensive than others, it is crucial to compare a company’s return on equity to companies within the same industry as opposed to crossing sectors. Generally, companies with high return on equity are showing the ability to use their balance sheets to create value for their shareholders.
No matter how well a stock screening methodology has performed (or underperformed) over the long term, it is important to realize that stock screening is only the first step in the stock-selection process. The stocks passing the Return on Equity screen do not represent a “recommended” or “buy” list of stocks. It is important to perform due diligence to verify the financial strength of the passing companies and to identify those stocks that match your investing tolerances and constraints before committing your investment dollars.

Related

Stock Strategies
Methods for Valuing a Stock Based on Profitability and Growth
Related

Financial Statements
Breaking Down ROE Using the DuPont Formula
Discussion
FREE REPORT

Get your free copy of our special
report analyzing the tech stocks
most likely to outperform the
market.
ALAN R from SC posted over 3 years ago:
You need to log in as a registered AAII user before commenting.
Log InCreate an account