


Wayne Thorp leads a class in AAII's new Essential Investing Video Course. Go to https://www.aaii.com/ves for more information and to subscribe.

Featured Tickers:
The AAII A+ Stock Grades system is a research and evaluation tool that seeks to grade companies within five investment key factors: value, growth, momentum, earnings estimate revisions and quality. The grades measure key metrics within each factor and determine a relative score that seeks to separate the strong versus the weak candidates.
These grades are part of AAII’s A+ Investor online investment discovery, analysis and tracking service, which is also part of the AAII Platinum bundle.
The grades were designed to be an educational and insightful research tool for the individual investor. Our goal was not to create a black box ranking system. Instead, we focused on identifying the metrics that investors can use to gauge a company’s relative standing within critical investment factors such as value or momentum.
In constructing the grades, we drew upon research not only from academic resources but from market participants as well, seeking to isolate those factors that have shown a strong relationship with future performance. Since rolling out the grades system in early 2020, we have continued to research improvements to the underlying components and their use. For example, we refined the A+ Value Grade and the A+ Quality Grade, making them more robust by including additional elements. A backtest of the revised grades for the period from 1998 through 2019 indicated improved correlated future returns from A (best 20%) through F (worst 20%). In other words, stocks with lower grades typically did worse than stocks with higher grades. The improvements also broadened the range of stocks eligible for a grade.
Recently, we endeavored to see if we could improve upon the A+ Growth Grade. Among the most widely followed investment factors, growth is arguably the most subjective. Value is applicable across several well-recognized metrics that relate a stock’s price or liquidation value to items such as earnings, cash flow, dividends or assets. In addition, momentum looks at price change, usually over no more than a year.
The foundation of growth investing is seeking out stocks of companies exhibiting strong, consistent and prolonged growth that is expected to continue into the future. When it comes to growth, though, questions abound. Growth in what? Growth over what period?
As such, growth has several dimensions, including year-over-year increases in sales and earnings, long(er)-term historical sales and earnings growth rates and analyst-forecasted long-term earnings growth estimates. Interestingly, the S&P 500 Pure Growth index considers three elements: growth in sales per share, the change in the relationship between earnings per share and share price over the last three years and price momentum.
When we launched A+ Investor in early 2020, the Growth Grade looked at growth in sales, earnings per share and operating cash flow on a year-over-year basis for the latest fiscal quarter and annualized growth over the past five years. The intent was to rank companies by their short- and long-term growth across income statement and cash flow items. This original Growth Grade rewarded companies that posted the highest growth rates across the six elements.
However, “slow and steady wins the race” generally holds when it comes to using growth parameters, especially over the long term. A common theme with investing is the reversion to the mean. Mean reversion has historically occurred when market segments with abnormally high profitability attract competition, leading to an eventual decrease in profitability. Whether the periods of low profitability are cyclical or competition-based, when a company begins to miss quarterly financial estimates, its stock price will fall and stay low for a time. This cycle of profitability impacts valuations, margins and growth rates. The investing risk of seeking absolute high growth encompasses both the fundamental difficulty of continuing high levels of growth over time and the behavioral elements of investors overpaying for that high growth when it is most visible.
Considering mean reversion, the original Growth Grade accurately captured past performance, but it had a flaw in that it did not necessarily relate to future price performance or a company’s future growth potential. It rewarded companies with the highest absolute levels of growth, but a company growing by, say, 100% a year can’t sustain that over the long term. And when the market realizes that growth is starting to wane and revert to the mean, the stock price also usually falls.
Analysis presented by Matthew Bajkowski in his article “Strong Estimated Growth Fails to Lead to Strong Returns” (July 2021 AAII Journal) illustrates this point. The analysis looked at projected growth rates and found that companies with the highest projected growth rates failed to deliver high price returns. Looking at the period from 1998 through 2019, companies that ranked in the bottom 20% and top 20% of the stock universe based on their forecasted one- and two-year earnings growth rates underperformed those in the middle 60%.
Building a Better Growth Grade
When planning our analysis for a new Growth Grade, the first step was to identify the underlying data fields to consider. Initially, the Growth Grade used growth in sales, earnings per share and operating cash flow on a year-over-year basis for the last fiscal quarter and on a compound annual basis over the past five years.
Year-Over-Year Sales Growth
Sales (revenues) are what generate cash and earnings for a company. Without top-line growth, companies will struggle to survive. For this reason, we felt it was essential to examine a company’s sales track record, but with an eye for consistency of annual increases. For the revised Growth Grade, we first looked at a company’s year-over-year sales growth over the past five periods (year 6 to year 5, year 5 to year 4, year 4 to year 3, year 3 to year 2 and year 2 to year 1). The goal was to seek out companies regularly growing revenue every year, not simply those with the greatest rates of change over the last five years.
Companies with annual sales increases for each of the last five years were awarded a score of 100, whereas companies that did not see any annual increases in sales were awarded a score of 0. In theory, the more a company is consistently able to increase sales every year, the better its stock will perform.
Figure 1 shows that this was the case. We tested the universe of U.S.-listed stocks from the beginning of 1998 through the end of May 2022, dividing the universe annually into six segments based on the number of periods of sales increase (five, four, three, two, one and zero).
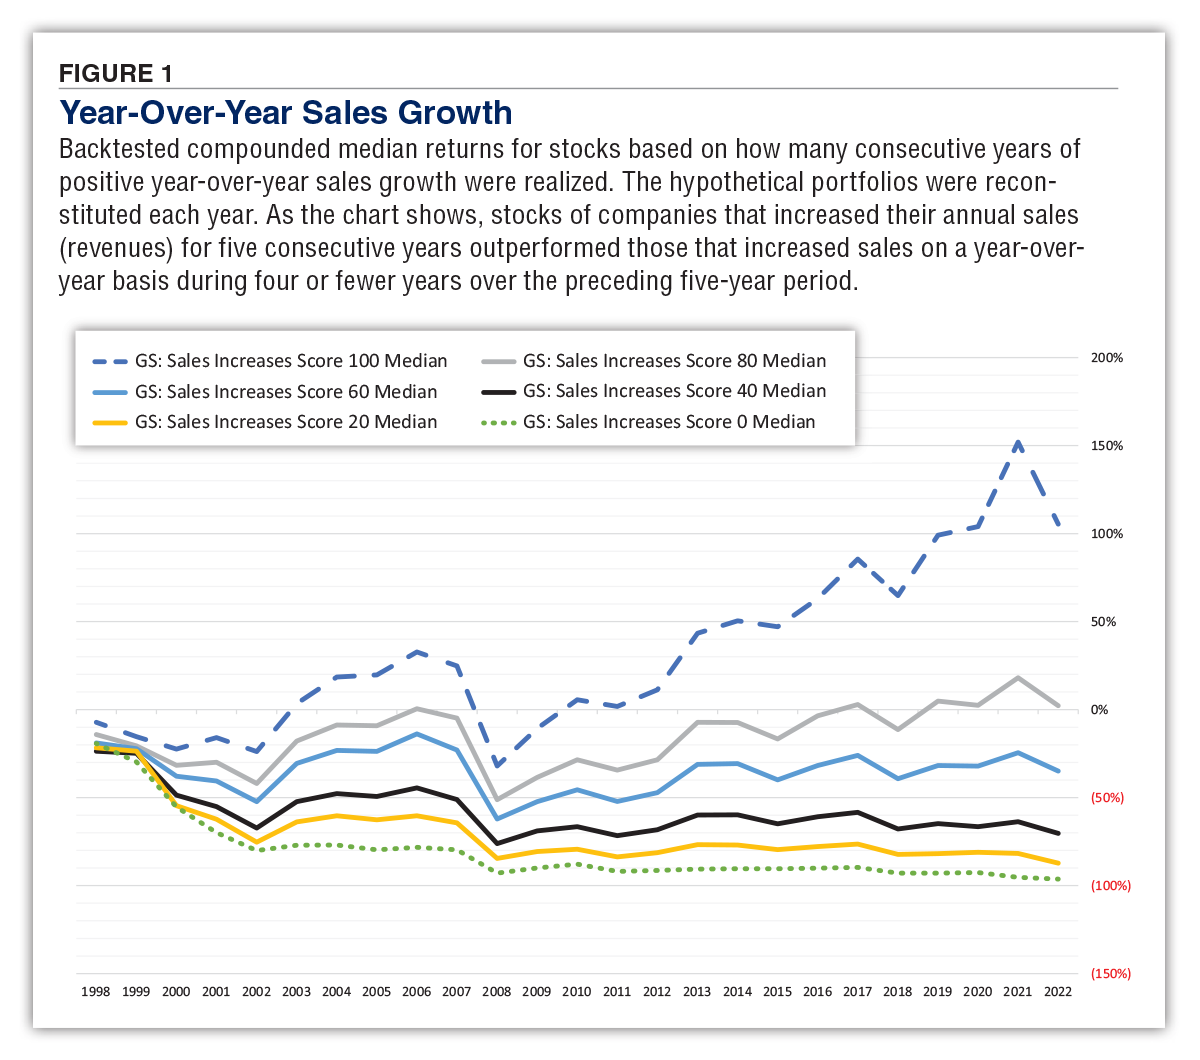
Over the testing period, the stocks of companies that saw their sales increase in each of the past five years outperformed all others by a wide margin. Interestingly, the performance dipped for each additional year sales didn’t increase, such that companies without any annual increases in sales performed the worst over the testing period.
Five-Year Average Annual Sales Growth
When examining a company’s sales growth, we also wanted to look at the magnitude of growth over the long(er) term. As we had seen, stocks with the strongest and weakest sales growth underperformed stocks with positive, yet slower and more sustainable, levels of growth.
To this end, we examined a company’s percentile rank for five-year annualized sales growth. We divided the stock universe into quintiles and awarded higher weightings for five-year sales growth ranking in the middle 60% of the stock universe. In comparison, lower weightings were awarded to those companies at the extremes—either too high or too low. Specifically, the greatest weight was awarded to companies that ranked in the 40th to 59th percentiles of five-year sales growth (weight of 100), followed by the 60th to 79th percentiles (80), 20th to 39th percentiles (60), 80th or higher percentiles (40) and 19th percentile or lower (20).
Here we are trying to find the “sweet spot” of growth—not too high and not too low.
Again, across these five segments, we tested the universe of U.S.-listed stocks from the beginning of 1998 through the end of May 2022. Again, over the testing period, the stocks of companies with the highest weightings based on their five-year sales growth rank outperformed all others, as shown in Figure 2.
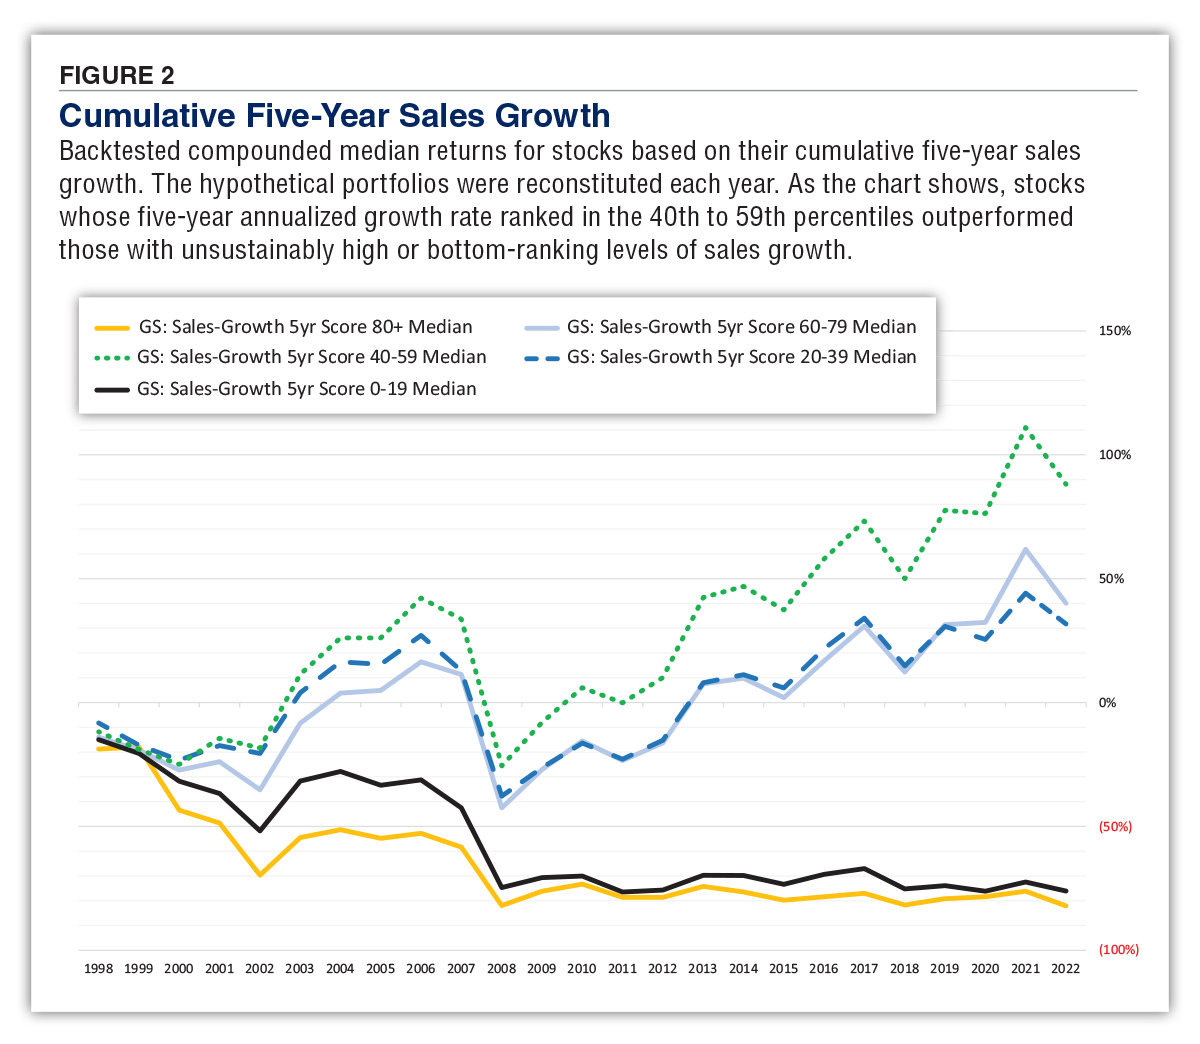
We also see that companies with the highest five-year sales growth performed almost equally as bad as those with the lowest. This seems to support reversion to the mean at the high-growth end. Conceptually, this makes sense, as companies with the highest growth rates cannot expect to continue that level of growth for very long. Eventually, the rate of growth will fade, and the market will react to this waning growth by knocking down the share price. At the lowest-growth end, it appears that the prospects for these companies are perpetually poor, and the market reacts accordingly.
Annual Cash From Operations
For the revised Growth Grade, we did not directly consider earnings growth. While closely followed by analysts and investors, earnings are impacted by management accounting assumptions. In addition, a company can boost its profitability (earnings per share) by repurchasing shares.
Yet we still felt it was important to consider bottom-line profitability, since revenue without profits will eventually lead to failure. So, we looked at how successful companies are at generating cash from operations. Cash flow forms one of the most critical parts of business operations and accounts for the total amount of money being transferred in and out of the business. Internal cash generation allows a company to expand, build and launch new products, buy back shares, pay dividends or reduce debt without the need for additional capital inflows.
Specifically, we look at cash from operations, which indicates the amount of money a company brings in from its ongoing regular business activities, such as manufacturing and selling goods or providing a service to customers. Cash from operations focuses only on the core business and does not include the impact of investments into (or divestitures out of) the business nor does it consider capital inflows or outflows such as dividends.
Positive (and increasing) cash flow from operating activities indicates that the company’s core business activities are thriving. It also provides an additional measure of the profitability potential of a company, in addition to the traditional ones like net income.
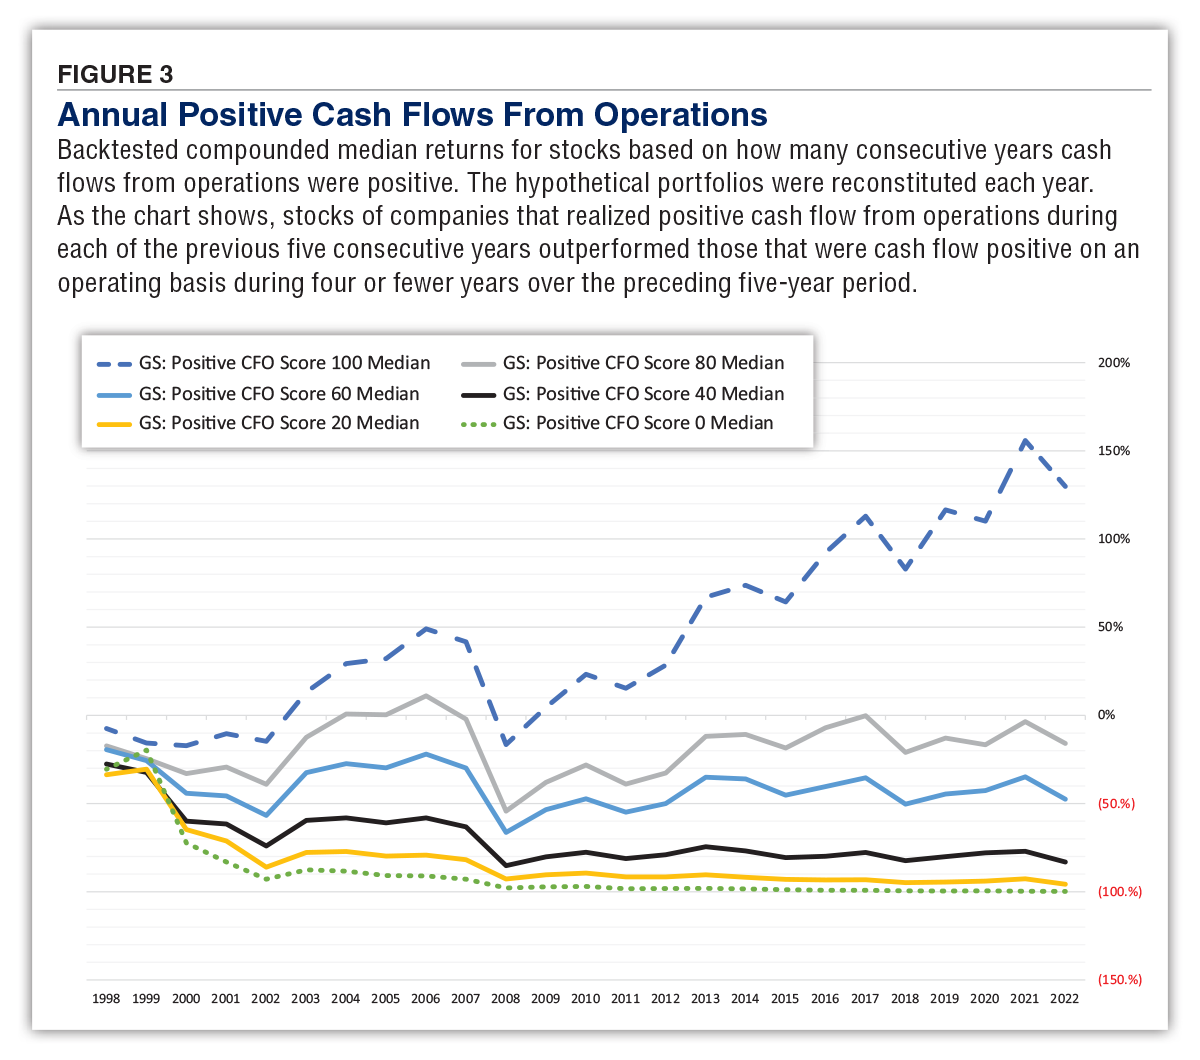
We looked at a company’s consistency in generating positive annual cash from operations over the past five years for the revised Growth Grade. Companies that generate positive cash from operations in each of the past five years were awarded a score of 100. In contrast, companies that did not generate positive cash from operations in any of the past five years were awarded a score of 0. In theory, the more regularly a company generates positive cash from operations, the more likely its stock will perform better.
Figure 3 indicates that this is true. Considering only a company’s consistency in operating cash flow over each of the past five years, the group that posted positive operating cash over each of the trailing five years was the only group to generate positive cumulative returns over the testing period.
Calculating the Revised Growth Grade
To arrive at the revised Growth Score, we first determined the percentile ranks for each of the three individual components: consistency of annual sales growth, five-year sales growth rankings adjusted for extreme levels, and consistency of positive annual cash from operations. We then added these three rank figures. This sum is ranked against the entire stock universe to arrive at a company’s revised Growth Score to create an equal distribution of grades.
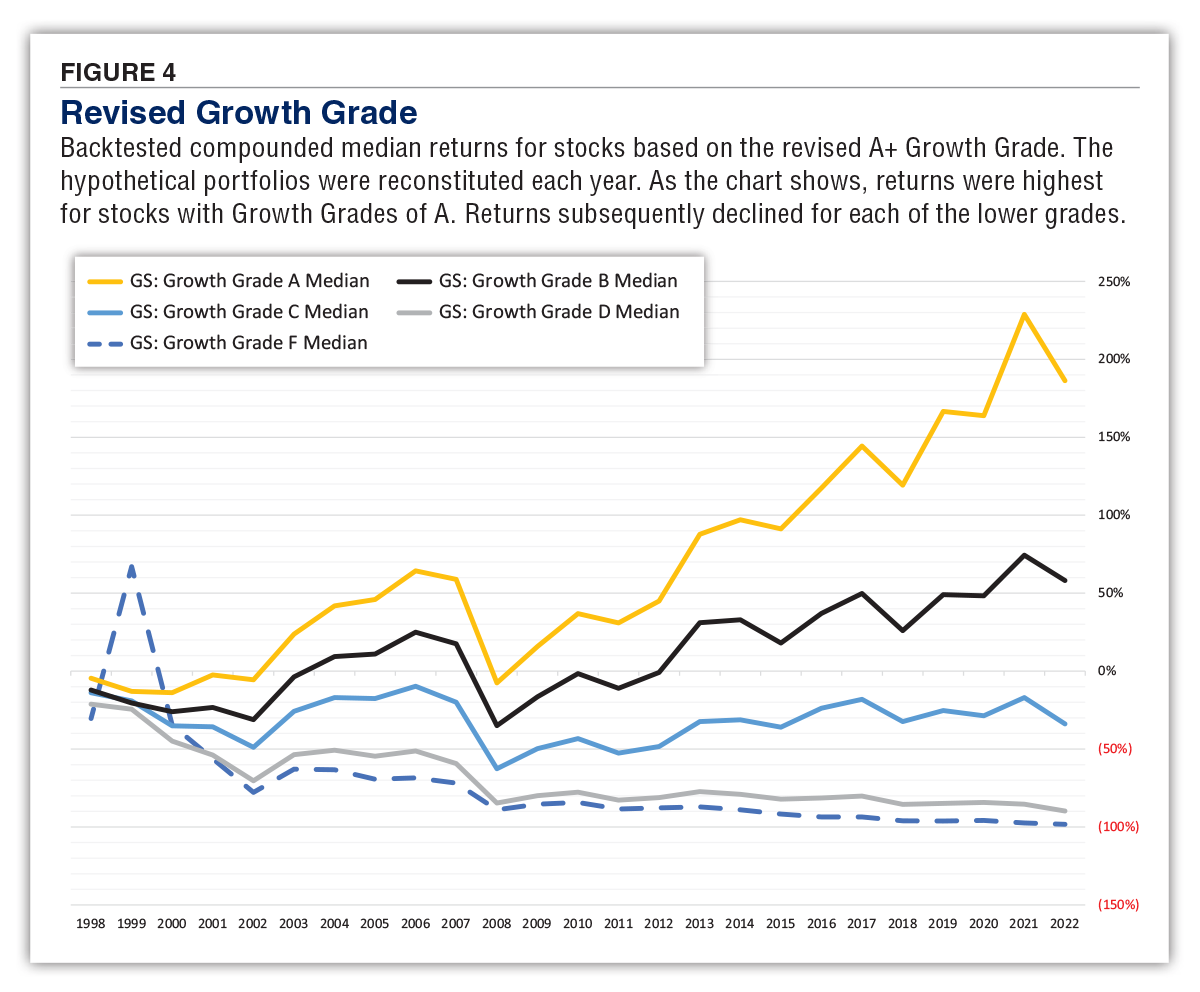
The companies in the bottom 20% of the stock universe receive Growth Grades of F (very weak), while those in the top 20% receive A grades (very strong).
We then did a final round of testing, looking at the performance of stocks across the five Growth Grades.
As Figure 4 shows, the companies with A grades outperformed lower-grade stocks across the backtesting period. Furthermore, performance fell as you moved down the grade scale.
The Revised Growth Grade in the A+ Stock Evaluator
Figure 5 shows the new Growth Grade data display on the AAII Stock Evaluator page for Alphabet Inc.  (GOOGL). The data for the Growth Grade and the other four grades is located under the “Grades” tab; this tab is accessible to A+ Investor and AAII Platinum subscribers.
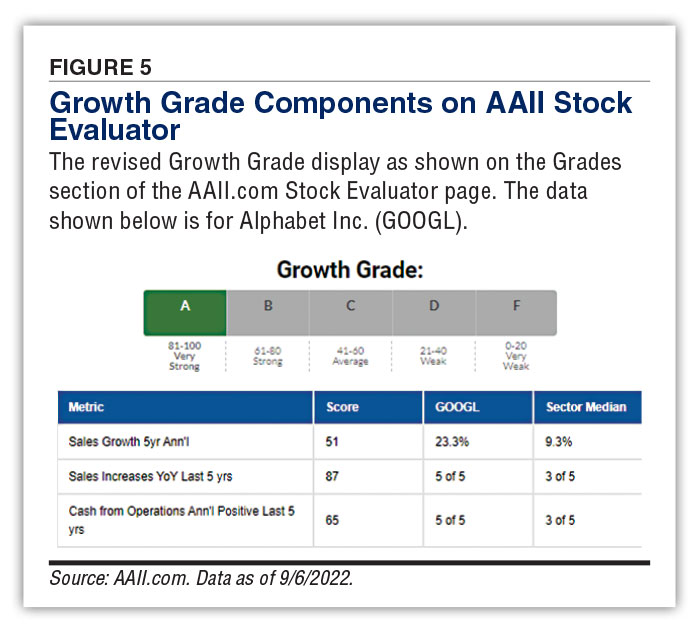
As of September 6, 2022, Alphabet has been growing its sales revenue by an average of 23.3% over the last five years. This ranks in the 82nd percentile, which means its component score is 40, using the scale we discussed previously. Compared to the other U.S.-traded stocks, this component score of 40 ranks in the 51st percentile of all stocks. Alphabet has also seen its sales increase every year for the past five fiscal years. In addition, it has also generated positive cash from operations for each of the past five fiscal years. Therefore, Alphabet receives component scores of 100 for year-over-year sales and annual cash from operations. Ranking these component scores across all U.S.-traded stocks results in ranks of 87 for Alphabet’s annual sales increase metric and 65 for the annual cash from operations metric. The ranks of these three components are then added together, with the sum being 203. This sum is ranked against the entire stock universe to determine the company’s overall Growth Score. The sum of 203 for Alphabet ranks in the 82nd percentile among all U.S.-traded stocks. This Growth Score of 82 translates into a Growth Grade of A for very strong.
A Revised and Better Growth Score
When we set out to improve the A+ Growth Grade, we were not looking to make changes merely for change’s sake. Instead, through our testing, we found evidence that we could build a better “mousetrap” to help our members identify promising growth stocks and the key components that make them so.
In fact, this improved metric serves as the cornerstone of AAII Growth Investing.

Related

Stock Strategies
Strong Estimated Growth Fails to Lead to Strong Returns
Related

Financial Statements
Analyzing Growth Rates
Discussion
FREE REPORT

Get your free copy of our special
report analyzing the tech stocks
most likely to outperform the
market.
JOHN L from NJ posted over 4 years ago:
Wayne T from IL posted over 4 years ago:
JOHN L from NJ posted over 4 years ago:
JERRY L from NC posted over 4 years ago:
JEAN H from IL posted over 4 years ago:
RALPH E from IL posted over 3 years ago:
BARRY J from TX posted over 2 years ago:
You need to log in as a registered AAII user before commenting.
Log InCreate an account